Trend Consensus Adaptive (Long-Only)
Trend Consensus Adaptive is designed to exploit the asymmetric positive expected returns of assets with positive trend consensus. It longs the top sextile (top 20%) of assets with the highest Trend Consensus, when the overall market trend is positive. It does not have any short exposure.
Unlike other portfolios, Trend Consensus Adaptive is long-only and is displayed here with 100% target gross exposure.
The asset universe consists of the most liquid and actively traded assets, identified on rolling basis - various techniques employed to keep it both stable and relevant, as well as survivorship-bias free.
To balance each asset's risk contribution, positions are scaled according to the inverse of their rolling volatility.
The factor is available (point-in-time) daily at 23:55 and 00:15 UTC.
| Benchmark (BTC) | Portfolio | |
|---|---|---|
1.00 | 1.82 | |
52.9% | 96.3% | |
0.00 | 0.55 | |
1.00 | 0.34 | |
-76.6% | -48.5% | |
61.2% | 41.9% | |
0% | 26.5% | |
100% | 39.8% | |
100% | 39.8% |
Sharpe Ratio
Rolling 12 MonthsBeta
Rolling 12 Months - Benchmark: BTCNet Exposure of Portfolio
Portfolio Variants
Current Weights
Adaptive Portfolio weights can be all zero when the risk signal scales the portfolio weights down.
| Ticker | Name | Arrival Price | Weight | Date |
|---|---|---|---|---|
| BTC | Bitcoin | 89360.837 USD | 0.00% | 2025-12-06T00:09:23.292552+00:00 |
| ETH | Ethereum | 3023.24 USD | 0.00% | 2025-12-06T00:09:23.292552+00:00 |
| SOL | Solana | 133.324 USD | 0.00% | 2025-12-06T00:09:23.292552+00:00 |
| XRP | Ripple | 2.037 USD | 0.00% | 2025-12-06T00:09:23.292552+00:00 |
| DOGE | Dogecoin | 0.14 USD | 0.00% | 2025-12-06T00:09:23.292552+00:00 |
| BNB | Binance Coin | 884.05 USD | 0.00% | 2025-12-06T00:09:23.292552+00:00 |
| ADA | Cardano | 0.416 USD | 0.00% | 2025-12-06T00:09:23.292552+00:00 |
| LTC | Litecoin | 80.474 USD | 0.00% | 2025-12-06T00:09:23.292552+00:00 |
| LINK | Chainlink | 13.605 USD | 0.00% | 2025-12-06T00:09:23.292552+00:00 |
| AVAX | Avalanche | 13.23 USD | 0.00% | 2025-12-06T00:09:23.292552+00:00 |
| DOT | Polkadot | 2.127 USD | 0.00% | 2025-12-06T00:09:23.292552+00:00 |
| BCH | Bitcoin Cash | 560.415 USD | 0.00% | 2025-12-06T00:09:23.292552+00:00 |
| HBAR | Hedera | 0.134 USD | 0.00% | 2025-12-06T00:09:23.292552+00:00 |
| TRX | TRON | 0.286 USD | 0.00% | 2025-12-06T00:09:23.292552+00:00 |
| UNI | Uniswap | 5.495 USD | 0.00% | 2025-12-06T00:09:23.292552+00:00 |
| TON | Toncoin | 1.573 USD | 0.00% | 2025-12-06T00:09:23.292552+00:00 |
| XLM | Stellar | 0.24 USD | 0.00% | 2025-12-06T00:09:23.292552+00:00 |
| SHIB | SHIB | 0.000008308348287608595 USD | 0.00% | 2025-12-06T00:09:23.292552+00:00 |
| HYPE | HYPE | 31.044 USD | 0.00% | 2025-12-06T00:09:23.292552+00:00 |
| XMR | Monero | 399.741 USD | 0.00% | 2025-12-06T00:09:23.292552+00:00 |
| 0.00% | ||||
Properties
Cross-Sectional | |
Derivative Exchanges | |
400+ Tickers | |
None | |
- | |
None |
2024-01-01 | |
Daily | |
23:55 & 00:15 UTC | |
Yes | |
- | |
No |
Frequently Asked Questions
What is the construction methodology of the model portfolio on display? How do I replicate it?
Is the raw factor data available?
What is smoothing? Some factors have by default setting (eg. 10 Day Moving Average) applied. Why is that?
What is the universe of assets? How is it determined? Is it survivorship-bias free?
What is the rebalancing frequency?
What are the transaction cost / slippage assumptions?
When have been the factors developed? Is there an out-of-sample period?
Some of the factors look great! Should I pick an individual factor and start trading it?
Replication & API
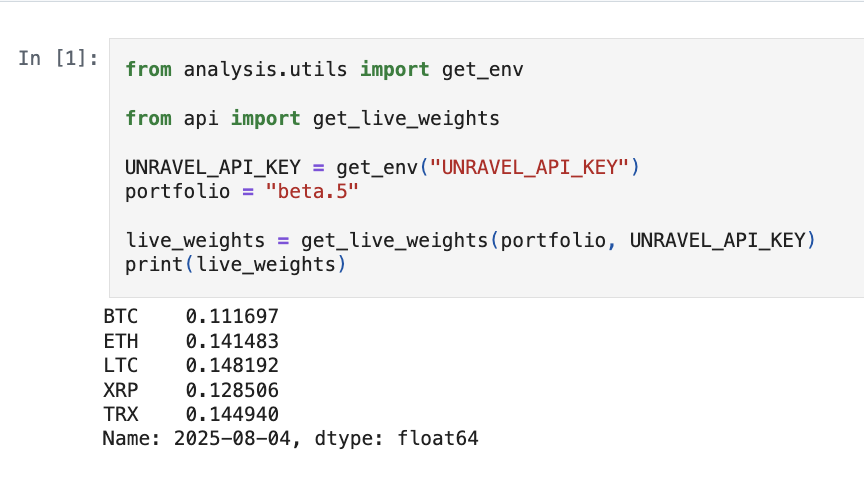
Live Weights
Get live weights with the code provided below.