Supply Velocity
Supply Velocity is the rate of change in publicly tradable tokens in circulation new issuance minus burn. Rising Supply Velocity signals increasing inflationary pressure; falling Supply Velocity suggests deflation or stabilization.
It was inspired by the observation that uncontrolled supply inflation can lead to distrust, and consequently, underperformance. We see increased attention to tokenomics, and that crypto is maturing into a more fundamental-driven market, where token holders appricate buyback and burn programs. This can be expressed with quantiative, fundamental factors such as Supply Velocity.
The asset universe consists of the most liquid and actively traded assets, identified on rolling basis - various techniques employed to keep it both stable and relevant, as well as survivorship-bias free.
To balance each asset's risk contribution, positions are scaled according to the inverse of their rolling volatility.
The factor is available (point-in-time) daily by 11:55pm UTC, assuming rebalancing at midnight UTC.
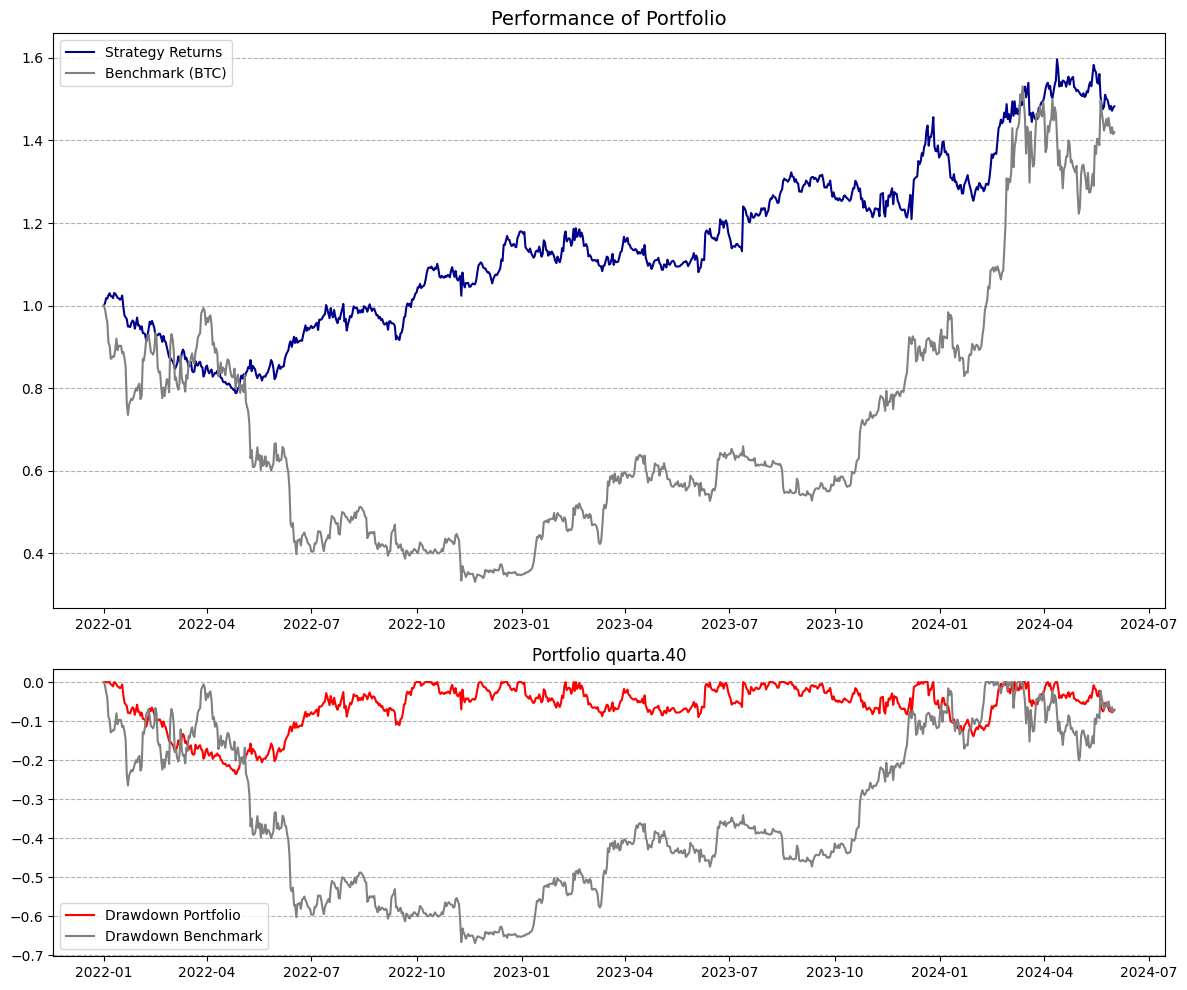
| Benchmark (BTC) | Portfolio | |
|---|---|---|
1.08 | 0.82 | |
60.7% | 26.7% | |
0.00 | 0.22 | |
1.00 | 0.13 | |
-76.6% | -49.7% | |
61.7% | 37.2% | |
0% | 13.5% | |
100% | 24.9% | |
100% | 200.2% |
Sharpe Ratio
Rolling 12 MonthsBeta
Rolling 12 Months - Benchmark: BTCNet Exposure of Portfolio
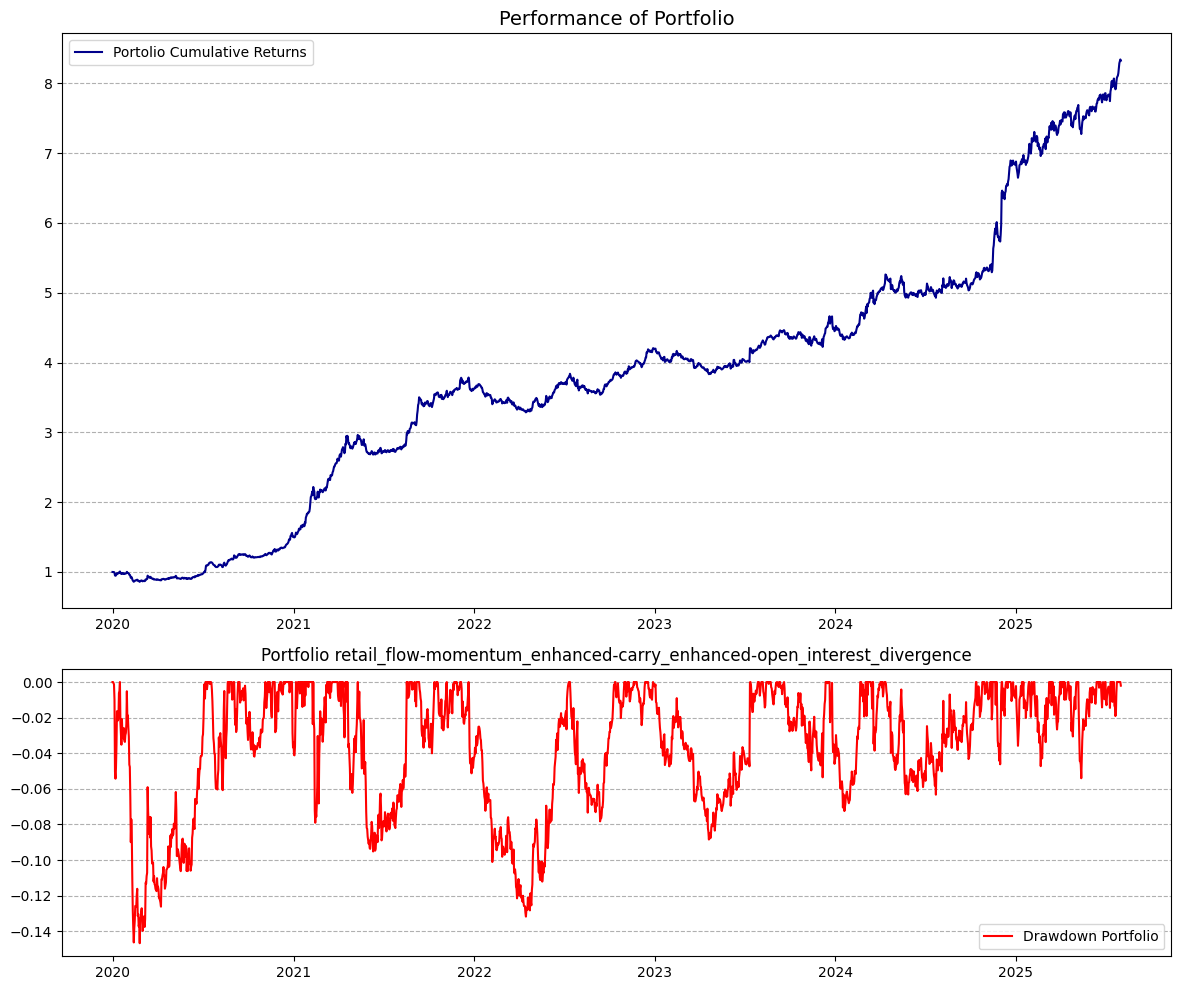
Portfolio Variants
Current Weights
| Ticker | Name | Arrival Price | Weight | Date |
|---|---|---|---|---|
| BTC | Bitcoin | 109691.781 USD | 0.00% | 2025-09-28T00:09:48.937876+00:00 |
| ETH | Ethereum | 4020.367 USD | 0.00% | 2025-09-28T00:09:48.937876+00:00 |
| SOL | Solana | 203.605 USD | 0.00% | 2025-09-28T00:09:48.937876+00:00 |
| XRP | Ripple | 2.807 USD | 0.00% | 2025-09-28T00:09:48.937876+00:00 |
| DOGE | Dogecoin | 0.231 USD | 0.00% | 2025-09-28T00:09:48.937876+00:00 |
| SUI | Sui | 3.18 USD | 0.00% | 2025-09-28T00:09:48.937876+00:00 |
| BNB | Binance Coin | 968.93 USD | 0.00% | 2025-09-28T00:09:48.937876+00:00 |
| ADA | Cardano | 0.782 USD | 0.00% | 2025-09-28T00:09:48.937876+00:00 |
| LTC | Litecoin | 104.546 USD | 0.00% | 2025-09-28T00:09:48.937876+00:00 |
| LINK | Chainlink | 20.928 USD | 0.00% | 2025-09-28T00:09:48.937876+00:00 |
| AVAX | Avalanche | 28.777 USD | 0.00% | 2025-09-28T00:09:48.937876+00:00 |
| DOT | Polkadot | 3.892 USD | 0.00% | 2025-09-28T00:09:48.937876+00:00 |
| BCH | Bitcoin Cash | 544.059 USD | 0.00% | 2025-09-28T00:09:48.937876+00:00 |
| ENA | ENA | 0.578 USD | 0.00% | 2025-09-28T00:09:48.937876+00:00 |
| HBAR | Hedera | 0.213 USD | 0.00% | 2025-09-28T00:09:48.937876+00:00 |
| TRX | TRON | 0.337 USD | 0.00% | 2025-09-28T00:09:48.937876+00:00 |
| UNI | Uniswap | 7.621 USD | 0.00% | 2025-09-28T00:09:48.937876+00:00 |
| TON | Toncoin | 2.71 USD | 0.00% | 2025-09-28T00:09:48.937876+00:00 |
| XLM | Stellar | 0.361 USD | 0.00% | 2025-09-28T00:09:48.937876+00:00 |
| SHIB | SHIB | 0.00001181409888 USD | 0.00% | 2025-09-28T00:09:48.937876+00:00 |
| 0.00% | ||||
Properties
Cross-Sectional | |
Directly from protocols | |
400+ Tickers | |
Percentage Change | |
200 - 300 Days | |
None |
2024-01-01 | |
Daily | |
11:55pm UTC | |
Yes | |
- | |
Yes |
Frequently Asked Questions
What is the construction methodology of the model portfolio on display? How do I replicate it?
Is the raw factor data available?
What is smoothing? Some factors have by default setting (eg. 10 Day Moving Average) applied. Why is that?
What is the universe of assets? How is it determined? Is it survivorship-bias free?
What is the rebalancing frequency?
What are the transaction cost / slippage assumptions?
When have been the factors developed? Is there an out-of-sample period?
Some of the factors look great! Should I pick an individual factor and start trading it?
Replication & API
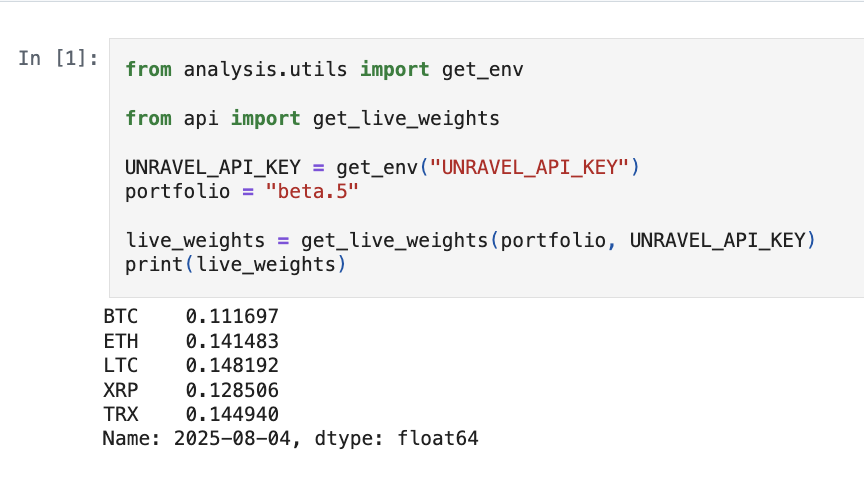
Live Weights
Get live weights with the code provided below.