Margin Risk
margin_risk.30Assets with higher at-risk-of-liquidation positions tend to underperform less leveraged assets.
- CAGR
- 43.1%
- Ann. vol
- 31.6%
- Sharpe
- 1.29
The factor capitalizes on the tendency of assets with higher at-risk-of-liquidation positions to underperform less leveraged assets.
Margin Risk predicts positions vulnerable to forced closure at 1%, 2%, 5%, and 10% deviations from the current price. Data is aggregated from the top 10 most reputable exchanges.
The asset universe consists of the most liquid and actively traded assets, identified on rolling basis - various techniques employed to keep it both stable and relevant, as well as survivorship-bias free.
To balance each asset's risk contribution, positions are scaled according to the inverse of their rolling volatility.
The factor is available (point-in-time) with hourly updates, 5 minutes past the hour (UTC).
| 2021 | 2022 | 2023 | 2024 | 2025 | 2026 | All |
|---|---|---|---|---|---|---|
| 2.9 | 5.1 | 2.1 | 2.6 | 3.1 | 2.1 | 7.2 |
Mean per-date Spearman rank IC divided by its standard error. |t| > 2 is roughly significant at 5%. First and last years may be partial.
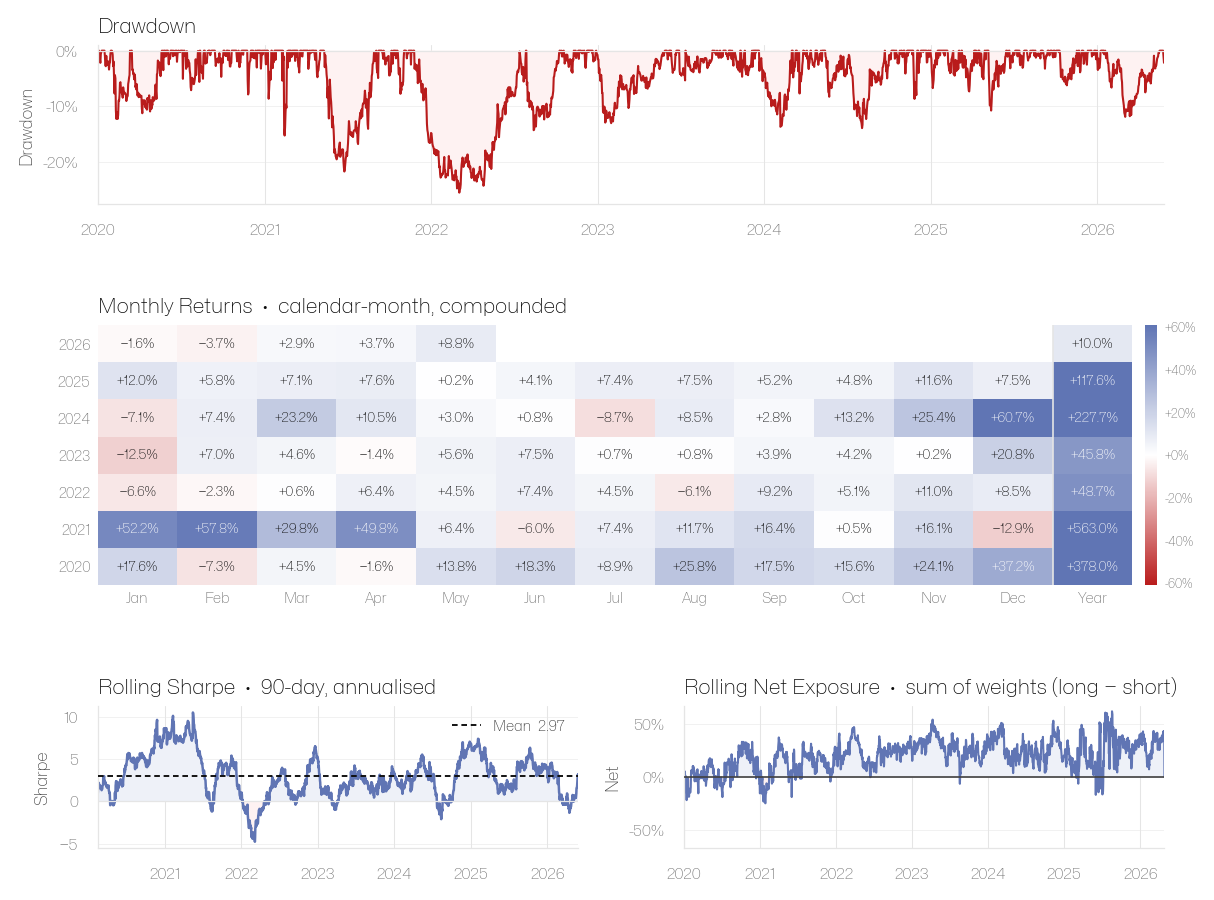
Performance
| Year | Jan | Feb | Mar | Apr | May | Jun | Jul | Aug | Sep | Oct | Nov | Dec | Year |
|---|---|---|---|---|---|---|---|---|---|---|---|---|---|
| 2021 | +44.9% | +69.8% | +3.1% | +9.0% | +2.3% | −4.0% | +5.1% | +2.1% | +7.4% | +7.3% | +14.8% | −2.4% | +276.7% |
| 2022 | −7.6% | +4.4% | −0.6% | +8.1% | +5.5% | −3.9% | −9.5% | −0.3% | −0.5% | +8.6% | +1.2% | +12.4% | +16.3% |
| 2023 | −7.9% | +3.5% | +4.5% | −1.6% | −0.7% | +0.1% | +7.7% | +2.5% | +0.4% | +3.3% | −3.1% | −5.6% | +2.0% |
| 2024 | −3.4% | +16.7% | −3.8% | +22.4% | −5.3% | +13.7% | +1.7% | +7.4% | −9.1% | −4.7% | +1.1% | +24.7% | +70.4% |
| 2025 | +5.2% | +3.2% | +13.4% | −9.9% | −5.6% | +3.9% | +2.1% | −2.8% | +6.9% | +13.0% | +0.5% | +5.4% | +37.9% |
| 2026 | −1.1% | −11.0% | +0.9% | +5.0% | +3.0% | −13.2% | +3.8% | +7.4% | −11.5% | −3.8% | −0.8% | — | −21.5% |
Rolling metrics & exposure
Portfolio variants
Current Weights
| Ticker | Name | Arrival Price | Weight | Date |
|---|---|---|---|---|
| BTC | Bitcoin | 64555.214 USD | 0.00% | 2026-11-18T10:05:26.920785+00:00 |
| ETH | Ethereum | 1811.244 USD | 0.00% | 2026-11-18T10:05:26.920785+00:00 |
| SOL | Solana | 75.054 USD | 0.00% | 2026-11-18T10:05:26.920785+00:00 |
| XRP | Ripple | 0.998 USD | 0.00% | 2026-11-18T10:05:26.920785+00:00 |
| DOGE | Dogecoin | 0.05958383100560486 USD | 0.00% | 2026-11-18T10:05:26.920785+00:00 |
| SUI | Sui | 0.731 USD | 0.00% | 2026-11-18T10:05:26.920785+00:00 |
| BNB | Binance Coin | 591.091 USD | 0.00% | 2026-11-18T10:05:26.920785+00:00 |
| ADA | Cardano | 0.154 USD | 0.00% | 2026-11-18T10:05:26.920785+00:00 |
| LTC | Litecoin | 44.607 USD | 0.00% | 2026-11-18T10:05:26.920785+00:00 |
| LINK | Chainlink | 9.2 USD | 0.00% | 2026-11-18T10:05:26.920785+00:00 |
| ONDO | ONDO | 0.308 USD | 0.00% | 2026-11-18T10:05:26.920785+00:00 |
| AVAX | Avalanche | 7.14 USD | 0.00% | 2026-11-18T10:05:26.920785+00:00 |
| DOT | Polkadot | 0.729 USD | 0.00% | 2026-11-18T10:05:26.920785+00:00 |
| BCH | Bitcoin Cash | 208.837 USD | 0.00% | 2026-11-18T10:05:26.920785+00:00 |
| PEPE | PEPE | 0.000003741398535191 USD | 0.00% | 2026-11-18T10:05:26.920785+00:00 |
| HBAR | Hedera | 0.05764462152432677 USD | 0.00% | 2026-11-18T10:05:26.920785+00:00 |
| TRX | TRON | 0.309 USD | 0.00% | 2026-11-18T10:05:26.920785+00:00 |
| AAVE | Aave | 111.738 USD | 0.00% | 2026-11-18T10:05:26.920785+00:00 |
| TAO | Bittensor | 196.469 USD | 0.00% | 2026-11-18T10:05:26.920785+00:00 |
| NEAR | NEAR Protocol | 3.347 USD | 0.00% | 2026-11-18T10:05:26.920785+00:00 |
| XLM | Stellar | 0.141 USD | 0.00% | 2026-11-18T10:05:26.920785+00:00 |
| SHIB | SHIB | 0.000003848828153658 USD | 0.00% | 2026-11-18T10:05:26.920785+00:00 |
| HYPE | HYPE | 68.735 USD | 0.00% | 2026-11-18T10:05:26.920785+00:00 |
| XMR | Monero | 506.63 USD | 0.00% | 2026-11-18T10:05:26.920785+00:00 |
| QNT | QNT | 157.763 USD | 0.00% | 2026-11-18T10:05:26.920785+00:00 |
| ZEC | ZEC | 949.26 USD | 0.00% | 2026-11-18T10:05:26.920785+00:00 |
| PUMP | PUMP | 0.002722093135301279 USD | 0.00% | 2026-11-18T10:05:26.920785+00:00 |
| WLFI | WLFI | 0.04610419866049698 USD | 0.00% | 2026-11-18T10:05:26.920785+00:00 |
| ASTER | ASTER | 0.553 USD | 0.00% | 2026-11-18T10:05:26.920785+00:00 |
| GRAM | GRAM | 1.071 USD | 0.00% | 2026-11-18T10:05:26.920785+00:00 |
| 0.00% | ||||
Properties
- Type
- Cross-Sectional
- Data Source
- Derivative Exchanges
- Universe
- 400+ Tickers
- Default Smoothing
- 10 Day
- Out-of-Sample Period Starts
- 2024-01-01
- Data Frequency
- Daily
- Data Availability
- Hourly, 5 minutes past the hour (UTC)
- Point-in-Time
- Yes
Frequently asked questions
What is the construction methodology of the model portfolio on display? How do I replicate it?
Is the raw factor data available?
What is smoothing? Some factors have by default setting (eg. 10 Day Moving Average) applied. Why is that?
What is the universe of assets? How is it determined? Is it survivorship-bias free?
What is the rebalancing frequency?
What are the transaction cost / slippage assumptions?
When have been the factors developed? Is there an out-of-sample period?
Some of the factors look great! Should I pick an individual factor and start trading it?
Replication & API
All resourcesMargin Risk Factor Analysis

Replicate Spectra — our flagship multi-factor portfolio
Replicate Portfolio Backtest
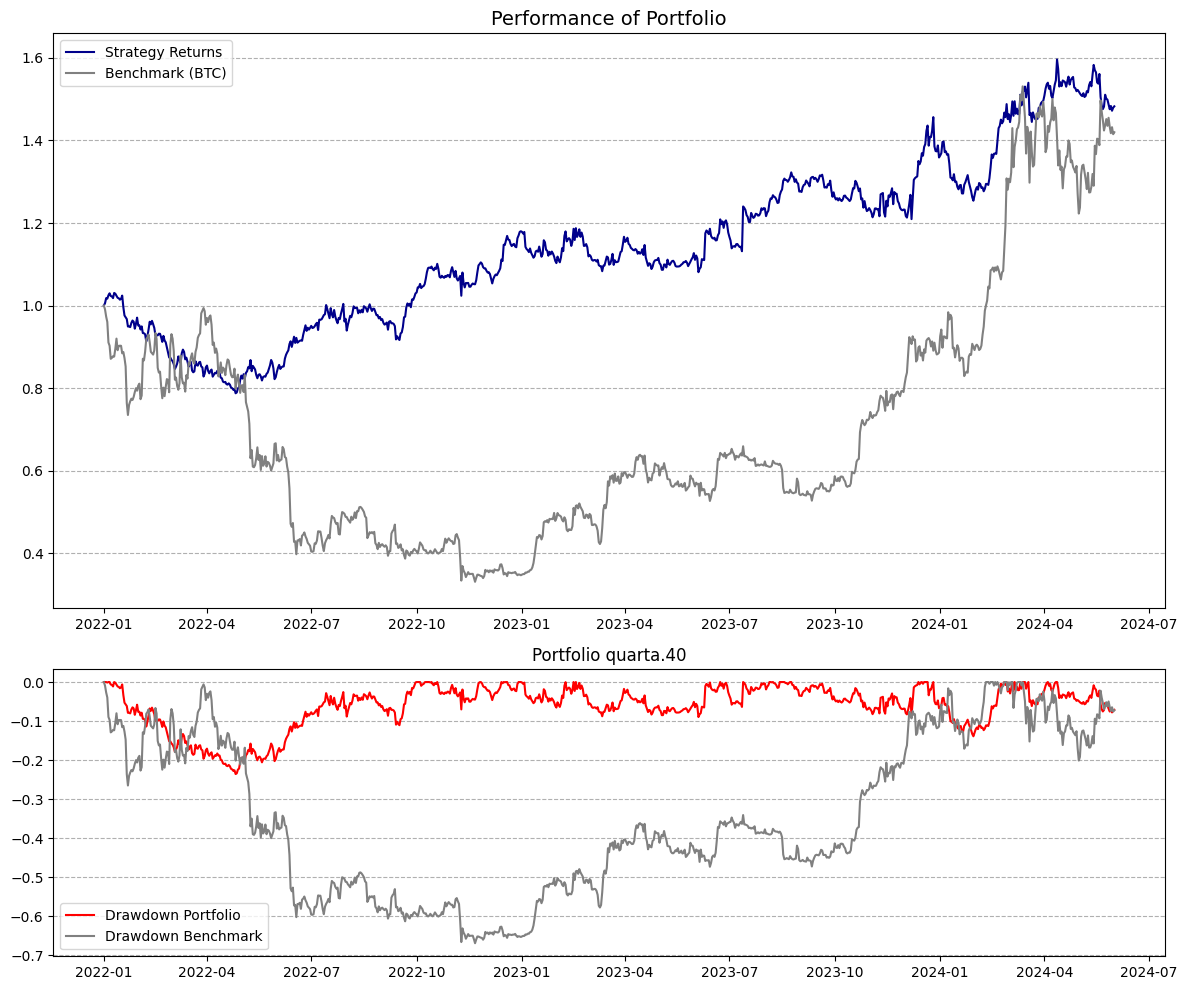
Get Live Weights