Flow Saturation
flow_saturation.20Market-NeutralOrder FlowSingle-FactorTop 20 Market Cap
- CAGR
- -47.2%
- Ann. vol
- 39.2%
- Sharpe
- -1.43
The asset universe consists of the most liquid and actively traded assets, identified on rolling basis - various techniques employed to keep it both stable and relevant, as well as survivorship-bias free.
To balance each asset's risk contribution, positions are scaled according to the inverse of their rolling volatility.
The factor is available (point-in-time) with hourly updates, 5 minutes past the hour (UTC).
Rank IC t-stat by year
| 2020 | 2021 | 2022 | 2023 | 2024 | 2025 | 2026 | All |
|---|---|---|---|---|---|---|---|
| 0.7 | 1.3 | 0.4 | 1.6 | 1.6 | −0.3 | 1.3 | 2.4 |
Mean per-date Spearman rank IC divided by its standard error. |t| > 2 is roughly significant at 5%. First and last years may be partial.
Performance
Jan 1, 2020 – Nov 22, 2026
Transaction costs
Cumulative returnsRebased to 100 · 0.05% transaction costs
Rolling 90-day rank ICMean daily Spearman IC of the signal against next-day returns
Performance
Report Period Start Date Jan 2020 · End Date Nov 2026Cumulative Returns
MTD0.0%
Last Month9.1%
1M0.0%
3M0.0%
YTD−7.7%
Annualised Returns (CAGR)
1Y−7.7%
3Y−40.2%
5Y−35.3%
SI−47.3%
Risk Profile
Realised Volatility (annualised)
1M75.8%
3M49.7%
1Y52.4%
3Y54.4%
5Y46.6%
SI47.7%
Max Drawdown
%−99.0%
Date2026-06-18
Monthly returns
| Year | Jan | Feb | Mar | Apr | May | Jun | Jul | Aug | Sep | Oct | Nov | Dec | Year |
|---|---|---|---|---|---|---|---|---|---|---|---|---|---|
| 2020 | −16.3% | +2.7% | +21.2% | −5.1% | −6.1% | −11.9% | −16.9% | −10.4% | −10.0% | −7.5% | −25.8% | −30.3% | −73.8% |
| 2021 | −32.1% | −11.2% | −15.8% | −17.3% | −1.8% | +9.3% | +0.8% | −10.1% | +5.6% | −0.9% | −8.9% | +5.9% | −58.8% |
| 2022 | +2.8% | −3.6% | −0.9% | −7.5% | −11.2% | +1.1% | −6.8% | +9.8% | −4.4% | −8.1% | −5.1% | −9.3% | −37.0% |
| 2023 | +10.3% | +1.3% | −2.6% | +8.1% | −5.0% | −19.7% | +11.5% | −4.4% | −6.2% | −0.0% | −4.9% | −19.0% | −30.9% |
| 2024 | +6.4% | −6.0% | −29.8% | −12.1% | +0.0% | −6.9% | −7.4% | +0.0% | +16.0% | −6.9% | −25.9% | +15.0% | −51.1% |
| 2025 | −0.0% | −4.3% | +9.1% | +0.0% | −4.2% | −8.7% | −9.5% | −10.5% | −5.9% | −12.5% | −7.1% | +0.0% | −43.5% |
| 2026 | +7.7% | +7.1% | +6.7% | +0.0% | −25.0% | +0.0% | +0.0% | −8.3% | +0.0% | +9.1% | +0.0% | — | −7.7% |
Rolling metrics & exposure
Net exposureDaily, from the portfolio weights
Last 30 days hidden — subscribe for live portfolio weights.
Sharpe RatioRolling 12 months
BetaRolling 12 months · Benchmark: BTC
Portfolio variants
Current Weights
11/22/2026, 4:04:48 PM (UTC)
The portfolio is designed to be market-neutral on a volatilty-adjusted basis, therefore it may have net directional exposure on any given day. The weighting mechanism ensures that volatility-weighted directional exposure is negligible on the portfolio level.
| Ticker | Name | Arrival Price | Weight | Date |
|---|---|---|---|---|
| BTC | Bitcoin | 60812.282 USD | 0.00% | 2026-11-22T16:04:48.000593+00:00 |
| ETH | Ethereum | 1716.299 USD | 0.00% | 2026-11-22T16:04:48.000593+00:00 |
| SOL | Solana | 70.271 USD | 0.00% | 2026-11-22T16:04:48.000593+00:00 |
| XRP | Ripple | 0.924 USD | 0.00% | 2026-11-22T16:04:48.000593+00:00 |
| DOGE | Dogecoin | 0.05525741313475225 USD | 0.00% | 2026-11-22T16:04:48.000593+00:00 |
| SUI | Sui | 0.657 USD | 0.00% | 2026-11-22T16:04:48.000593+00:00 |
| BNB | Binance Coin | 556.351 USD | 0.00% | 2026-11-22T16:04:48.000593+00:00 |
| ADA | Cardano | 0.145 USD | 0.00% | 2026-11-22T16:04:48.000593+00:00 |
| LTC | Litecoin | 39.843 USD | 0.00% | 2026-11-22T16:04:48.000593+00:00 |
| LINK | Chainlink | 8.806 USD | 0.00% | 2026-11-22T16:04:48.000593+00:00 |
| AVAX | Avalanche | 6.674 USD | 0.00% | 2026-11-22T16:04:48.000593+00:00 |
| BCH | Bitcoin Cash | 197.882 USD | 0.00% | 2026-11-22T16:04:48.000593+00:00 |
| TRX | TRON | 0.305 USD | 0.00% | 2026-11-22T16:04:48.000593+00:00 |
| NEAR | NEAR Protocol | 3.002 USD | 0.00% | 2026-11-22T16:04:48.000593+00:00 |
| UNI | Uniswap | 4.701 USD | 0.00% | 2026-11-22T16:04:48.000593+00:00 |
| XLM | Stellar | 0.127 USD | 0.00% | 2026-11-22T16:04:48.000593+00:00 |
| HYPE | HYPE | 62.768 USD | 0.00% | 2026-11-22T16:04:48.000593+00:00 |
| XMR | Monero | 487.607 USD | 0.00% | 2026-11-22T16:04:48.000593+00:00 |
| ZEC | ZEC | 794.092 USD | 0.00% | 2026-11-22T16:04:48.000593+00:00 |
| GRAM | GRAM | 0.984 USD | 0.00% | 2026-11-22T16:04:48.000593+00:00 |
| 0.00% | ||||
Properties
Factor properties
- Type
- Cross-Sectional
- Data Source
- Derivative Exchanges
- Universe
- 400+ Tickers
- Default Smoothing
- None
- Out-of-Sample Period Starts
- 2024-01-01
- Data Frequency
- Daily
- Data Availability
- Hourly, 5 minutes past the hour (UTC)
- Point-in-Time
- Yes
Frequently asked questions
What is the construction methodology of the model portfolio on display? How do I replicate it?
The portfolio is constructed by applying cross-sectional binning - quantiles. This ensures that the weights are calculated in proportion to the strength of the factor. The assets are then weighted according to the inverse of their rolling volatility, to mitigate the impact of widely different volatilities of digital assets. We provide a replication notebook in the "Resources" section that will produce a very similar portfolio than what's shown on the site.
Is the raw factor data available?
Yes, we serve the raw factor data via the "portfolio/factors" endpoint to subscribers on a paid plan, please see the API Docs for more information.
What is smoothing? Some factors have by default setting (eg. 10 Day Moving Average) applied. Why is that?
Some of the cross-sectional factors have very high turnover, and despite being highly predictive, the alpha does not survive transaction costs. Smoothing (applying a simple moving average) is a way to reduce the turnover and the impact of transaction costs.
What is the universe of assets? How is it determined? Is it survivorship-bias free?
The universe of assets (there are multiple variants, for example, top 20, 30, 40 market cap digital assets) is the most liquid and actively traded assets, identified on rolling basis - various techniques (volume, open interest, volatility filters) are employed to keep it both stable and relevant. The universe is survivorship-bias free.
What is the rebalancing frequency?
The portfolio is rebalanced daily, with hourly updates, 5 minutes past the hour (UTC), and available point-in-time.
What are the transaction cost / slippage assumptions?
There are 0.05% transaction costs applied on each position adjustment. This is a parameter that can be adjusted in the backtest settings. Slippage, spread is not considered in the simplistic backtest that's on our site. We encourage using an independent backtesting infrastructure to validate performance.
When have been the factors developed? Is there an out-of-sample period?
Our cutoff date for our research process is 2024-01-01, we consider any data onwards as out-of-sample. Many factors have been traded live in some form from 2025-01-01.
Some of the factors look great! Should I pick an individual factor and start trading it?
We recommend using a portfolio of factors to maximize risk-adjusted returns. Alpha from individual factors is simply not consistent enough, and even running a simple arithmetic average of 3-5 relatively orthogonal factors will produce superior results.
Replication & API
All resourcesFlow Saturation Factor Analysis
Flow Saturation factor analysis with AlphaLens

Replicate Spectra — our flagship multi-factor portfolio
Reproduce Spectra, our 6-factor market-neutral portfolio, from its constituent Unravel factors
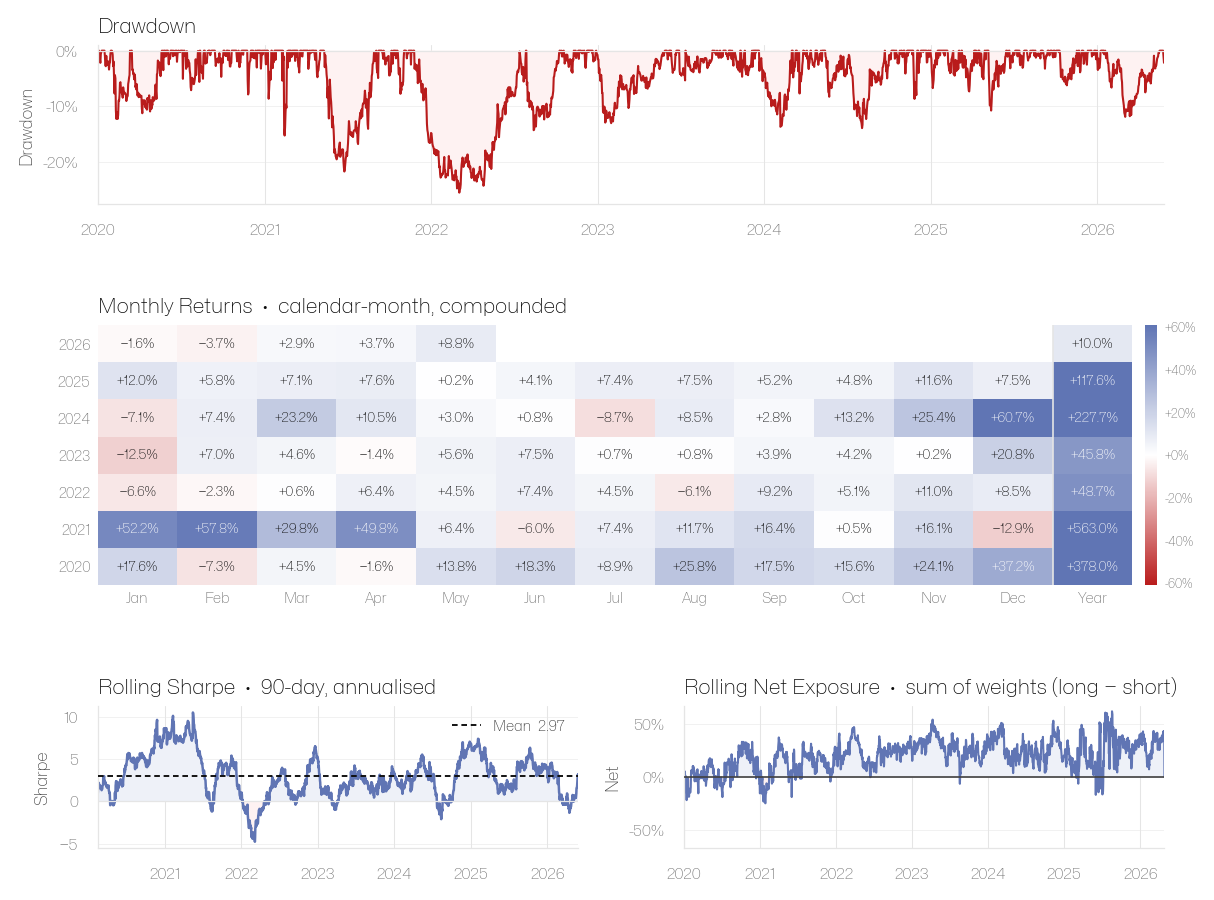
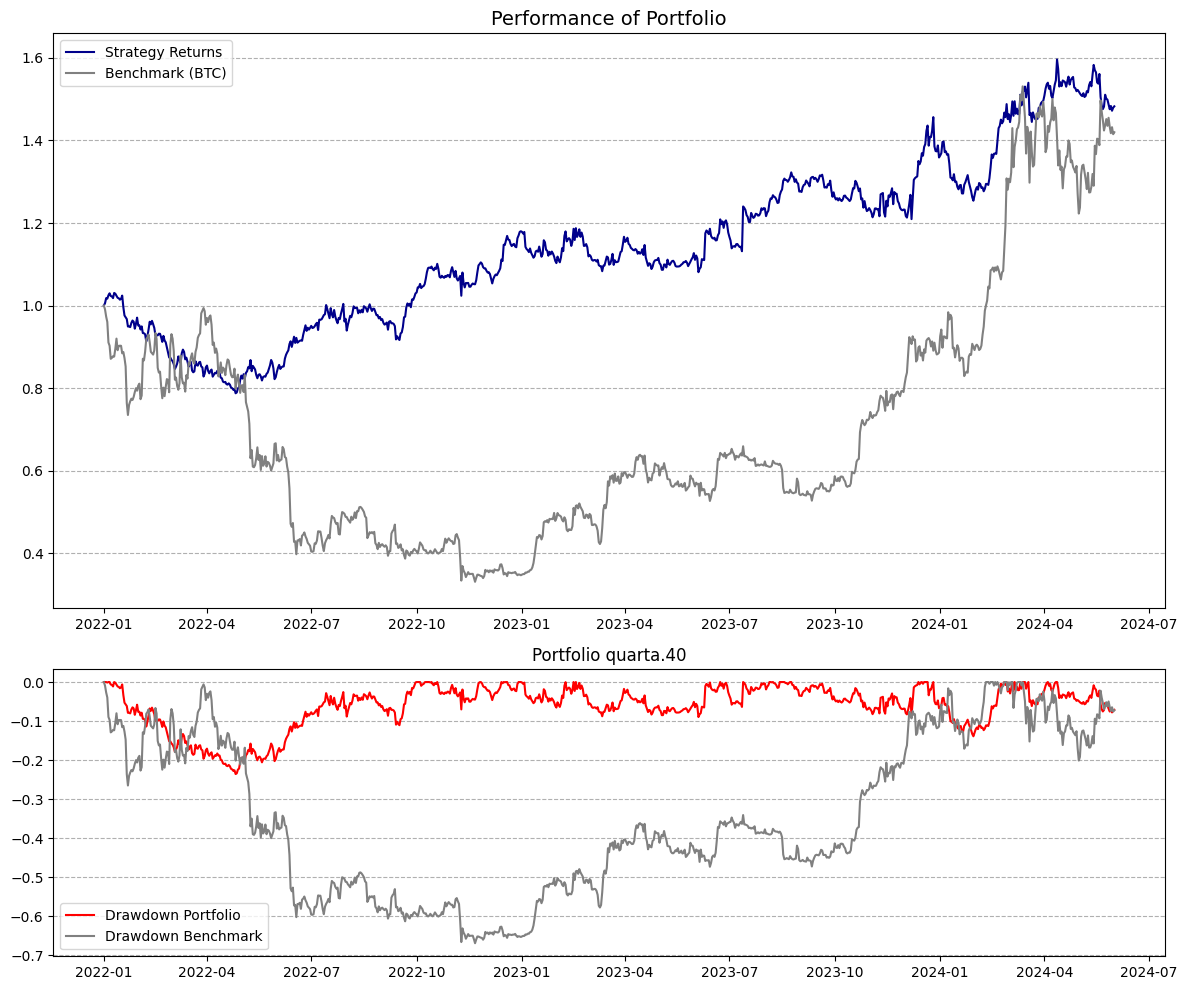
Replicate Portfolio Backtest
Replicate a portfolio backtest with Unravel API
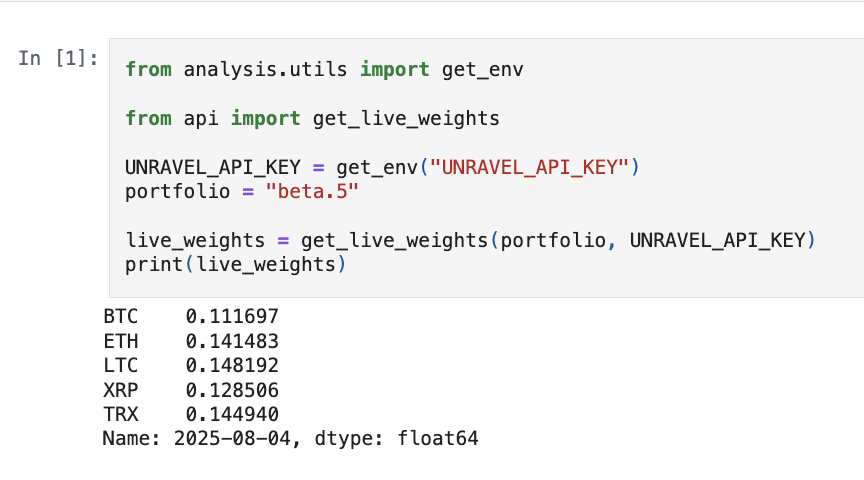
Get Live Weights
Get the live weights of the portfolio or the live factor data