Altair
Altair is a short-term liquidity metric, derived from the estimated slippage of trades (executed market orders) combined with (weighted by) market order imbalances. The data is collected real time and aggregated from the top 10 most reputable exchanges.
These short-term liquidity metrics expressed as a ratio, aggregated daily from the aforementioned sources. Altair is a high turnover (100%+ daily) factor that requires smoothing: a 20 day moving average is applied by default to reduce turnover and transaction costs.
The asset universe consists of the most liquid and actively traded assets, identified on rolling basis - various techniques employed to keep it both stable and relevant, as well as survivorship-bias free.
To balance each asset's risk contribution, positions are scaled according to the inverse of their rolling volatility.
The factor is available (point-in-time) daily by 11:55pm UTC, assuming rebalancing at midnight UTC.
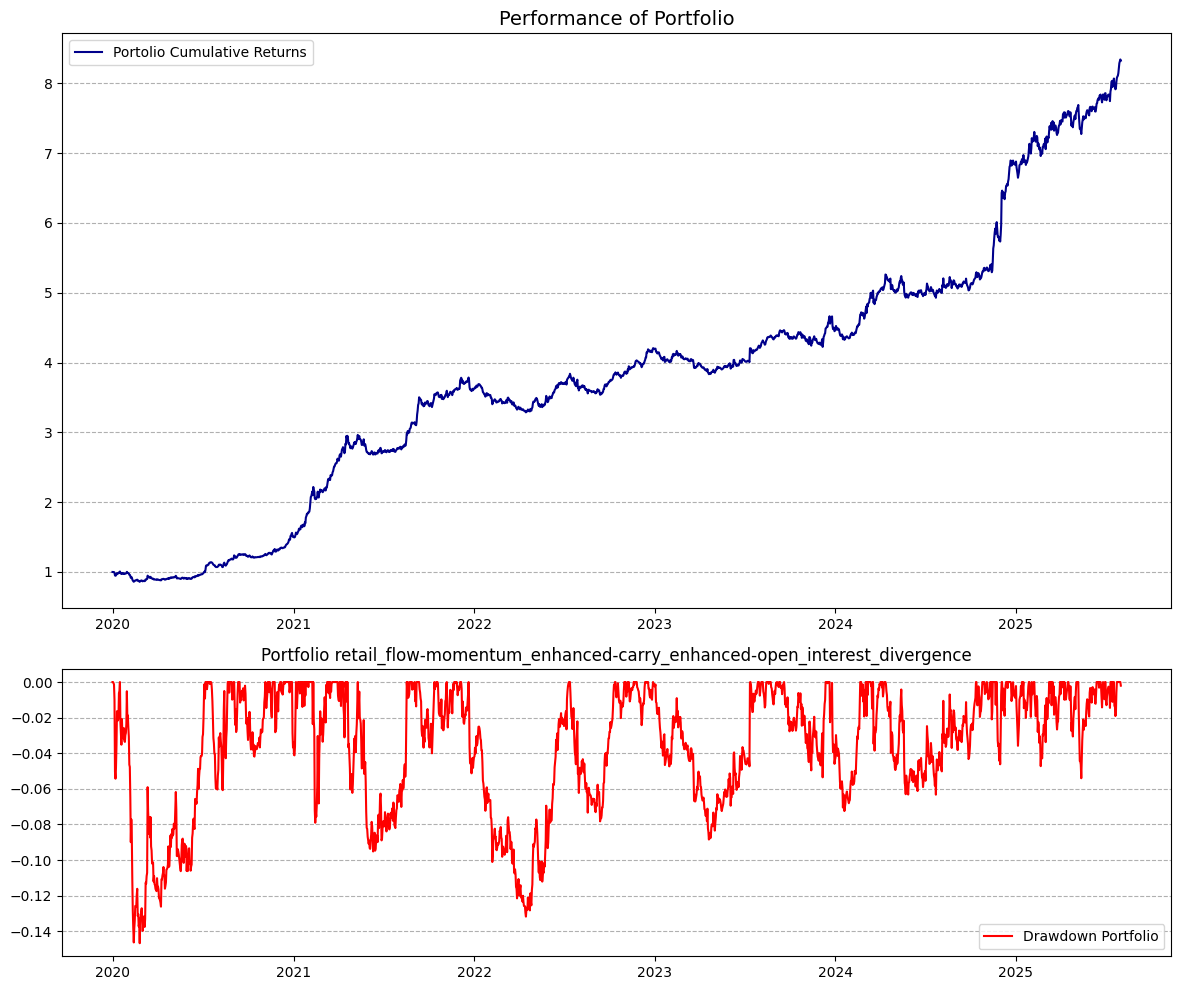
| Benchmark (BTC) | Portfolio | |
|---|---|---|
1.10 | 0.13 | |
62.9% | -0.5% | |
0.00 | 0.00 | |
1.00 | 0.05 | |
-76.6% | -71.1% | |
61.8% | 30.1% | |
0% | 217.7% | |
100% | 8.4% | |
100% | 201.5% |
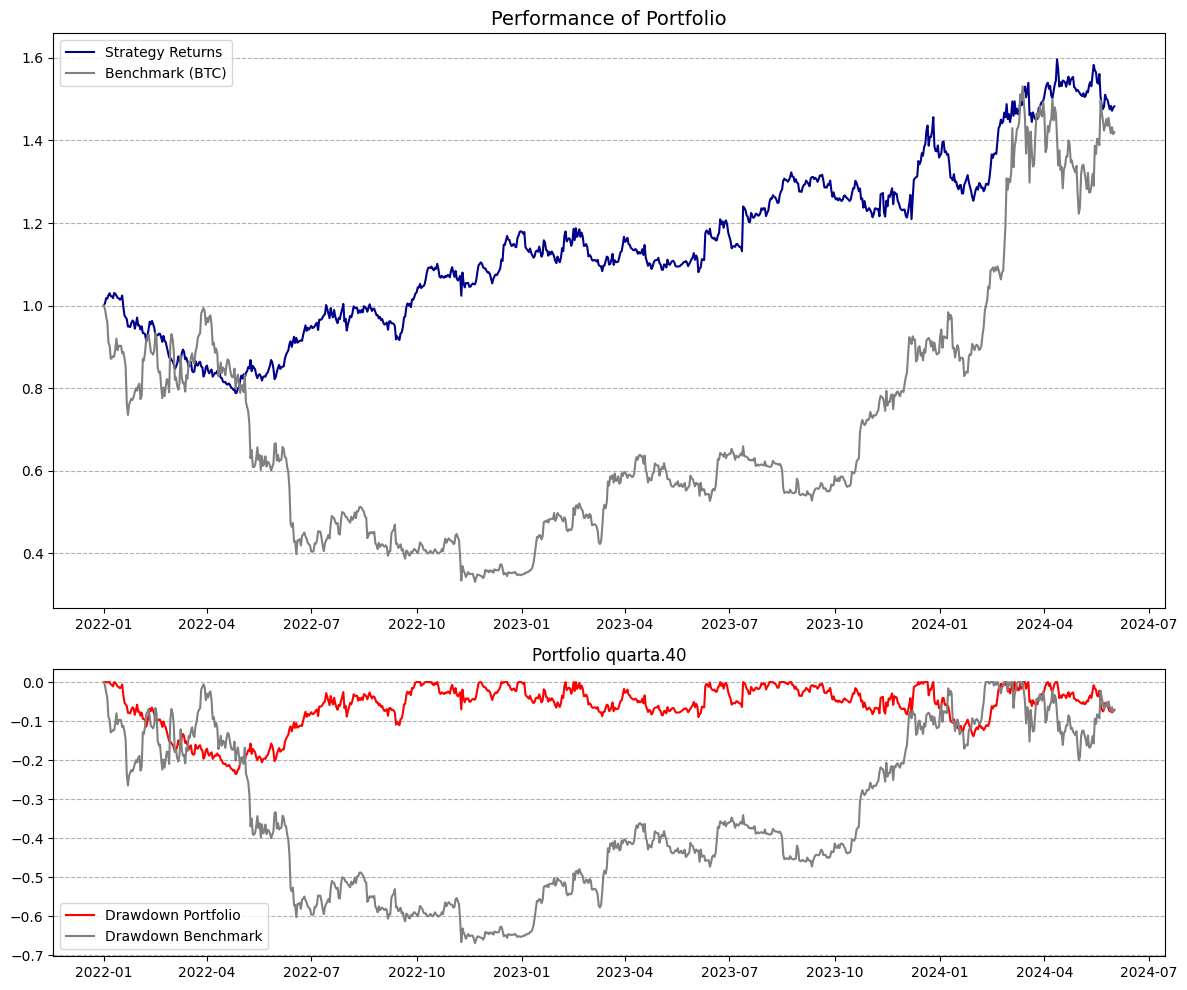
Sharpe Ratio
Rolling 12 MonthsBeta
Rolling 12 Months - Benchmark: BTCNet Exposure of Portfolio
Portfolio Variants
Current Weights
| Ticker | Name | Arrival Price | Weight | Date |
|---|---|---|---|---|
| BTC | Bitcoin | 116878.615 USD | 0.00% | 2025-09-16T23:55:00.000Z |
| ETH | Ethereum | 4519.653 USD | 0.00% | 2025-09-16T23:55:00.000Z |
| SOL | Solana | 237.867 USD | 0.00% | 2025-09-16T23:55:00.000Z |
| XRP | Ripple | 3.048 USD | 0.00% | 2025-09-16T23:55:00.000Z |
| DOGE | Dogecoin | 0.271 USD | 0.00% | 2025-09-16T23:55:00.000Z |
| SUI | Sui | 3.615 USD | 0.00% | 2025-09-16T23:55:00.000Z |
| BNB | Binance Coin | 957.429 USD | 0.00% | 2025-09-16T23:55:00.000Z |
| ADA | Cardano | 0.882 USD | 0.00% | 2025-09-16T23:55:00.000Z |
| TRUMP | TRUMP | 8.629 USD | 0.00% | 2025-09-16T23:55:00.000Z |
| LTC | Litecoin | 115.253 USD | 0.00% | 2025-09-16T23:55:00.000Z |
| LINK | Chainlink | 23.61 USD | 0.00% | 2025-09-16T23:55:00.000Z |
| ONDO | ONDO | 1.026 USD | 0.00% | 2025-09-16T23:55:00.000Z |
| AVAX | Avalanche | 30.112 USD | 0.00% | 2025-09-16T23:55:00.000Z |
| DOT | Polkadot | 4.276 USD | 0.00% | 2025-09-16T23:55:00.000Z |
| BCH | Bitcoin Cash | 601.073 USD | 0.00% | 2025-09-16T23:55:00.000Z |
| PEPE | PEPE | 0.00001102863645 USD | 0.00% | 2025-09-16T23:55:00.000Z |
| HBAR | Hedera | 0.239 USD | 0.00% | 2025-09-16T23:55:00.000Z |
| TRX | TRON | 0.343 USD | 0.00% | 2025-09-16T23:55:00.000Z |
| AAVE | Aave | 300.58 USD | 0.00% | 2025-09-16T23:55:00.000Z |
| FIL | Filecoin | 2.569 USD | 0.00% | 2025-09-16T23:55:00.000Z |
| TAO | Bittensor | 345.941 USD | 0.00% | 2025-09-16T23:55:00.000Z |
| NEAR | NEAR Protocol | 2.719 USD | 0.00% | 2025-09-16T23:55:00.000Z |
| UNI | Uniswap | 9.372 USD | 0.00% | 2025-09-16T23:55:00.000Z |
| APT | Aptos | 4.46 USD | 0.00% | 2025-09-16T23:55:00.000Z |
| TON | Toncoin | 3.167 USD | 0.00% | 2025-09-16T23:55:00.000Z |
| FET | FET | 0.646 USD | 0.00% | 2025-09-16T23:55:00.000Z |
| ETC | Ethereum Classic | 20.564 USD | 0.00% | 2025-09-16T23:55:00.000Z |
| XLM | Stellar | 0.385 USD | 0.00% | 2025-09-16T23:55:00.000Z |
| RENDER | RENDER | 3.886 USD | 0.00% | 2025-09-16T23:55:00.000Z |
| ARB | Arbitrum | 0.498 USD | 0.00% | 2025-09-16T23:55:00.000Z |
| SEI | SEI | 0.319 USD | 0.00% | 2025-09-16T23:55:00.000Z |
| ATOM | ATOM | 4.561 USD | 0.00% | 2025-09-16T23:55:00.000Z |
| VET | VeChain | 0.0245741639 USD | 0.00% | 2025-09-16T23:55:00.000Z |
| POL | Polygon | 0.259 USD | 0.00% | 2025-09-16T23:55:00.000Z |
| SHIB | SHIB | 0.00001319736957 USD | 0.00% | 2025-09-16T23:55:00.000Z |
| JUP | JUP | 0.519 USD | 0.00% | 2025-09-16T23:55:00.000Z |
| ALGO | Algorand | 0.239 USD | 0.00% | 2025-09-16T23:55:00.000Z |
| PENGU | PENGU | 0.033993129 USD | 0.00% | 2025-09-16T23:55:00.000Z |
| ICP | Internet Computer | 4.784 USD | 0.00% | 2025-09-16T23:55:00.000Z |
| BONK | BONK | 0.00002417570415 USD | 0.00% | 2025-09-16T23:55:00.000Z |
| 0.00% | ||||
Properties
Cross-Sectional | |
Derivative Exchanges | |
400+ Tickers | |
Ratio | |
- | |
20 Day |
2024-01-01 | |
Daily | |
11:55pm UTC | |
Yes | |
2 x 3 | |
No |
Frequently Asked Questions
What is the construction methodology of the model portfolio on display? How do I replicate it?
Is the raw factor data available?
What is smoothing? Some factors have by default setting (eg. 10 Day Moving Average) applied. Why is that?
What is the universe of assets? How is it determined? Is it survivorship-bias free?
What is the rebalancing frequency?
What are the transaction cost / slippage assumptions?
When have been the factors developed? Is there an out-of-sample period?
Some of the factors look great! Should I pick an individual factor and start trading it?
Replication & API
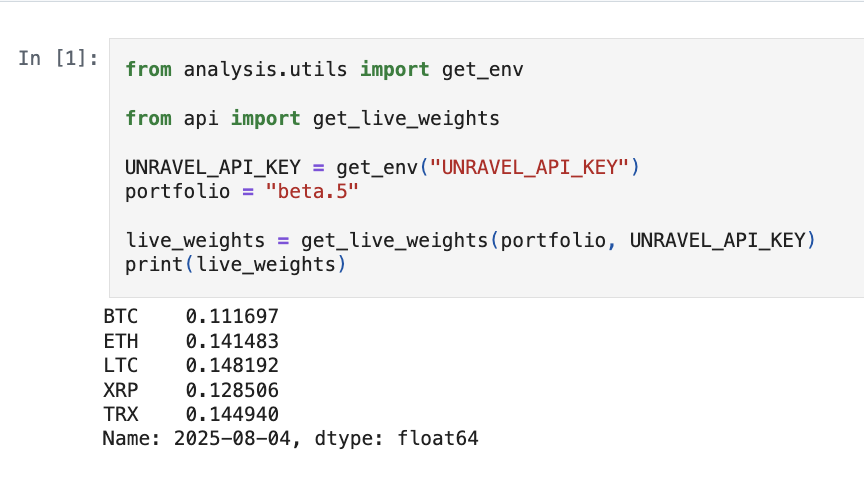
Live Weights
Get live weights with the code provided below.