Altair
Altair is a short-term liquidity metric that captures intraday market dynamics. The data is collected in real time and aggregated from the most reputable exchanges.
Altair is a high turnover factor that benefits from smoothing to reduce transaction costs.
The asset universe consists of the most liquid and actively traded assets, identified on a rolling basis various techniques are employed to keep it both stable and relevant, as well as survivorship-bias free.
To balance each asset's risk contribution, positions are scaled according to the inverse of their rolling volatility.
The factor is available (point-in-time) with hourly updates, 5 minutes past the hour (UTC).
Download data
| Benchmark (BTC) | Portfolio | |
|---|---|---|
0.86 | 1.63 | |
39% | 54.1% | |
0.00 | 0.43 | |
1.00 | 0.09 | |
-76.6% | -25.3% | |
59.7% | 29.1% | |
0% | 35.6% | |
100% | 20.4% | |
100% | 202.5% |
Period: Jan 1, 2020 – Aug 11, 2026
Performance
Report Period Start Date Jan 2020 · End Date Aug 2026Cumulative Returns
MTD1.4%
Last Month4.2%
1M1.6%
3M14.6%
YTD−1.2%
Annualised Returns (CAGR)
1Y39.5%
3Y74.5%
5Y39.2%
SI54.1%
Risk Profile
Realised Volatility (annualised)
1M18.8%
3M20.7%
1Y20.7%
3Y26.1%
5Y25.9%
SI29.1%
Max Drawdown
%−25.3%
Date2023-03-10
Monthly Returns Heatmap
| Year | Jan | Feb | Mar | Apr | May | Jun | Jul | Aug | Sep | Oct | Nov | Dec | Year |
|---|---|---|---|---|---|---|---|---|---|---|---|---|---|
| 2020 | +17.9% | −5.5% | +5.1% | −7.8% | +4.2% | +9.0% | +9.8% | +21.1% | +9.8% | +13.2% | −6.2% | +20.5% | +129.0% |
| 2021 | +15.2% | +17.3% | −11.1% | +21.7% | +11.6% | −11.7% | +1.9% | +2.5% | +2.0% | −1.2% | +11.8% | −7.0% | +57.9% |
| 2022 | −5.4% | +0.8% | +3.0% | +1.6% | −0.9% | −8.0% | +10.2% | −0.5% | −1.3% | +1.1% | +4.9% | +7.2% | +12.1% |
| 2023 | −11.0% | −10.5% | +1.6% | −0.9% | +7.0% | +5.0% | −7.7% | −5.0% | +9.9% | +3.4% | −2.4% | +1.5% | −11.1% |
| 2024 | −0.5% | +4.6% | +5.3% | −0.0% | +1.6% | +10.4% | −4.8% | +5.3% | −1.4% | +14.4% | +6.6% | +69.4% | +151.0% |
| 2025 | +8.7% | −3.9% | +6.8% | +1.7% | +9.3% | +8.2% | +1.0% | +7.3% | +8.5% | +4.9% | +10.9% | +6.7% | +95.6% |
| 2026 | −5.2% | −4.8% | +4.2% | +3.2% | −2.7% | −0.9% | +4.2% | +1.4% | — | — | — | — | −1.2% |
Rolling Metrics & Exposure
Net Exposure of Portfolio
Last 30 days hidden — subscribe for live portfolio weights.
Sharpe Ratio
Rolling 12 MonthsBeta
Rolling 12 Months - Benchmark: BTCPortfolio Variants
Current Weights
8/11/2026, 6:02:56 PM (UTC)
The portfolio is designed to be market-neutral on a volatilty-adjusted basis, therefore it may have net directional exposure on any given day. The weighting mechanism ensures that volatility-weighted directional exposure is negligible on the portfolio level.
| Ticker | Name | Arrival Price | Weight | Date |
|---|---|---|---|---|
| BTC | Bitcoin | 63558.239 USD | 0.00% | 2026-08-11T18:02:56.573175+00:00 |
| ETH | Ethereum | 1863.582 USD | 0.00% | 2026-08-11T18:02:56.573175+00:00 |
| SOL | Solana | 75.106 USD | 0.00% | 2026-08-11T18:02:56.573175+00:00 |
| XRP | Ripple | 1.014 USD | 0.00% | 2026-08-11T18:02:56.573175+00:00 |
| DOGE | Dogecoin | 0.07108464956696846 USD | 0.00% | 2026-08-11T18:02:56.573175+00:00 |
| SUI | Sui | 0.679 USD | 0.00% | 2026-08-11T18:02:56.573175+00:00 |
| BNB | Binance Coin | 609.838 USD | 0.00% | 2026-08-11T18:02:56.573175+00:00 |
| ADA | Cardano | 0.185 USD | 0.00% | 2026-08-11T18:02:56.573175+00:00 |
| LTC | Litecoin | 45.233 USD | 0.00% | 2026-08-11T18:02:56.573175+00:00 |
| LINK | Chainlink | 8.587 USD | 0.00% | 2026-08-11T18:02:56.573175+00:00 |
| ONDO | ONDO | 0.332 USD | 0.00% | 2026-08-11T18:02:56.573175+00:00 |
| AVAX | Avalanche | 6.212 USD | 0.00% | 2026-08-11T18:02:56.573175+00:00 |
| DOT | Polkadot | 0.782 USD | 0.00% | 2026-08-11T18:02:56.573175+00:00 |
| BCH | Bitcoin Cash | 211.875 USD | 0.00% | 2026-08-11T18:02:56.573175+00:00 |
| ENA | ENA | 0.08919193279325985 USD | 0.00% | 2026-08-11T18:02:56.573175+00:00 |
| PEPE | PEPE | 0.000002792504510676 USD | 0.00% | 2026-08-11T18:02:56.573175+00:00 |
| HBAR | Hedera | 0.06603660840339258 USD | 0.00% | 2026-08-11T18:02:56.573175+00:00 |
| TRX | TRON | 0.335 USD | 0.00% | 2026-08-11T18:02:56.573175+00:00 |
| AAVE | Aave | 86.93 USD | 0.00% | 2026-08-11T18:02:56.573175+00:00 |
| FIL | Filecoin | 0.702 USD | 0.00% | 2026-08-11T18:02:56.573175+00:00 |
| TAO | Bittensor | 198.894 USD | 0.00% | 2026-08-11T18:02:56.573175+00:00 |
| WLD | WLD | 0.335 USD | 0.00% | 2026-08-11T18:02:56.573175+00:00 |
| NEAR | NEAR Protocol | 1.558 USD | 0.00% | 2026-08-11T18:02:56.573175+00:00 |
| UNI | Uniswap | 3.692 USD | 0.00% | 2026-08-11T18:02:56.573175+00:00 |
| APT | Aptos | 0.575 USD | 0.00% | 2026-08-11T18:02:56.573175+00:00 |
| ETC | Ethereum Classic | 6.329 USD | 0.00% | 2026-08-11T18:02:56.573175+00:00 |
| XLM | Stellar | 0.161 USD | 0.00% | 2026-08-11T18:02:56.573175+00:00 |
| ARB | Arbitrum | 0.0781817844890472 USD | 0.00% | 2026-08-11T18:02:56.573175+00:00 |
| INJ | INJ | 4.465 USD | 0.00% | 2026-08-11T18:02:56.573175+00:00 |
| POL | Polygon | 0.07546351646421066 USD | 0.00% | 2026-08-11T18:02:56.573175+00:00 |
| SHIB | SHIB | 0.000004439844217266 USD | 0.00% | 2026-08-11T18:02:56.573175+00:00 |
| HYPE | HYPE | 53.948 USD | 0.00% | 2026-08-11T18:02:56.573175+00:00 |
| ICP | Internet Computer | 2.251 USD | 0.00% | 2026-08-11T18:02:56.573175+00:00 |
| XMR | Monero | 387.773 USD | 0.00% | 2026-08-11T18:02:56.573175+00:00 |
| AERO | AERO | 0.416 USD | 0.00% | 2026-08-11T18:02:56.573175+00:00 |
| DASH | DASH | 30.451 USD | 0.00% | 2026-08-11T18:02:56.573175+00:00 |
| ZEC | ZEC | 472.021 USD | 0.00% | 2026-08-11T18:02:56.573175+00:00 |
| WLFI | WLFI | 0.05491598687341211 USD | 0.00% | 2026-08-11T18:02:56.573175+00:00 |
| ASTER | ASTER | 0.601 USD | 0.00% | 2026-08-11T18:02:56.573175+00:00 |
| GRAM | GRAM | 1.324 USD | 0.00% | 2026-08-11T18:02:56.573175+00:00 |
| 0.00% | ||||
Properties
Cross-Sectional | |
Derivative Exchanges | |
400+ Tickers | |
20 Day |
2024-01-01 | |
Daily | |
Hourly, 5 minutes past the hour (UTC) | |
Yes |
Frequently Asked Questions
What is the construction methodology of the model portfolio on display? How do I replicate it?
The portfolio is constructed by applying cross-sectional binning - quantiles. This ensures that the weights are calculated in proportion to the strength of the factor. The assets are then weighted according to the inverse of their rolling volatility, to mitigate the impact of widely different volatilities of digital assets. We provide a replication notebook in the "Resources" section that will produce a very similar portfolio than what's shown on the site.
Is the raw factor data available?
Yes, we serve the raw factor data via the "portfolio/factors" endpoint, please see the API Docs for more information.
What is smoothing? Some factors have by default setting (eg. 10 Day Moving Average) applied. Why is that?
Some of the cross-sectional factors have very high turnover, and despite being highly predictive, the alpha does not survive transaction costs. Smoothing (applying a simple moving average) is a way to reduce the turnover and the impact of transaction costs.
What is the universe of assets? How is it determined? Is it survivorship-bias free?
The universe of assets (there are multiple variants, for example, top 20, 30, 40 market cap digital assets) is the most liquid and actively traded assets, identified on rolling basis - various techniques (volume, open interest, volatility filters) are employed to keep it both stable and relevant. The universe is survivorship-bias free.
What is the rebalancing frequency?
The portfolio is rebalanced daily, with hourly updates, 5 minutes past the hour (UTC), and available point-in-time.
What are the transaction cost / slippage assumptions?
There are 0.05% transaction costs applied on each position adjustment. This is a parameter that can be adjusted in the backtest settings. Slippage, spread is not considered in the simplistic backtest that's on our site. We encourage using an independent backtesting infrastructure to validate performance.
When have been the factors developed? Is there an out-of-sample period?
Our cutoff date for our research process is 2024-01-01, we consider any data onwards as out-of-sample. Many factors have been traded live in some form from 2025-01-01.
Some of the factors look great! Should I pick an individual factor and start trading it?
We recommend using a portfolio of factors to maximize risk-adjusted returns. Alpha from individual factors is simply not consistent enough, and even running a simple arithmetic average of 3-5 relatively orthogonal factors will produce superior results.
Replication & API
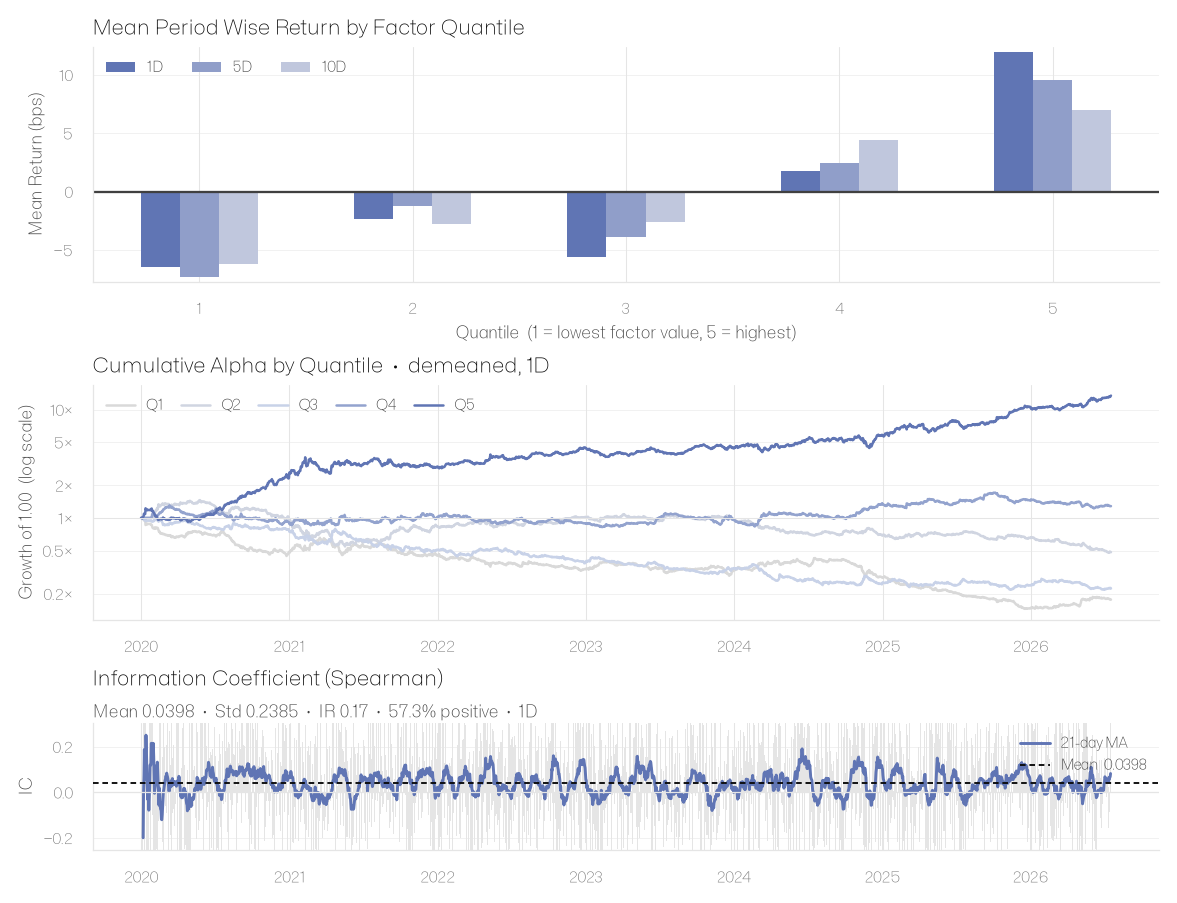
Altair Factor Analysis
Altair factor analysis with AlphaLens
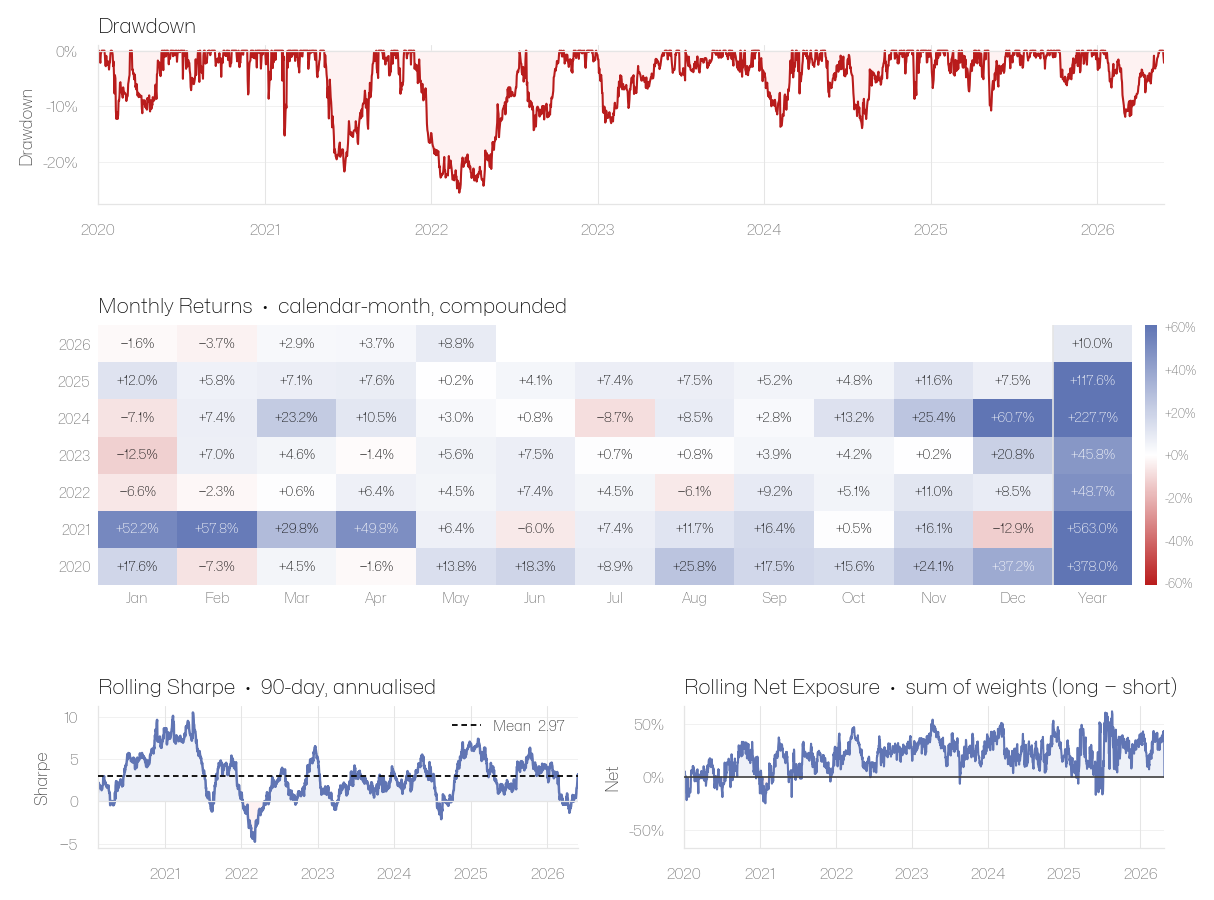
Replicate Spectra — our flagship multi-factor portfolio
Reproduce Spectra, our 6-factor market-neutral portfolio, from its constituent Unravel factors
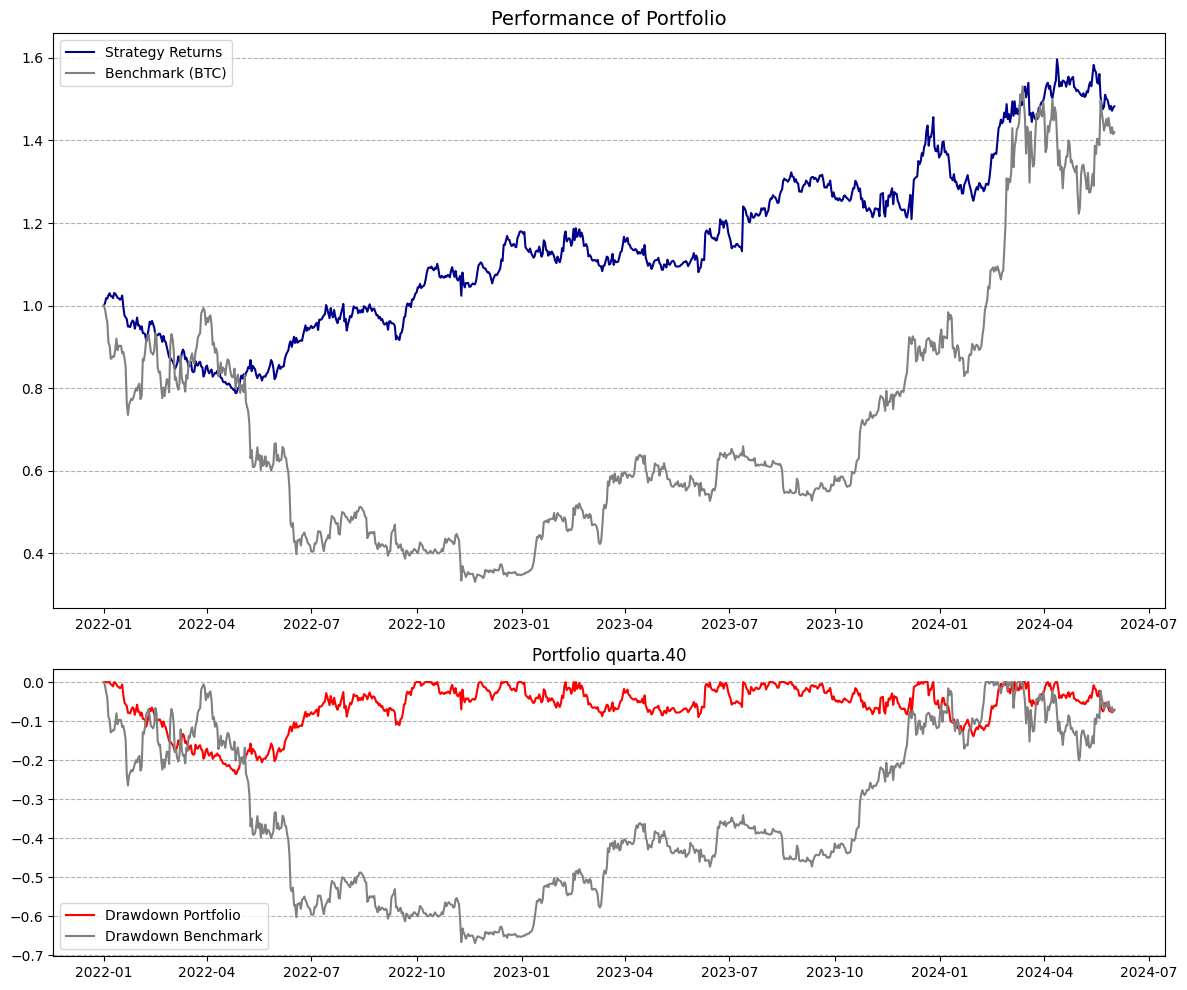
Replicate Portfolio Backtest
Replicate a portfolio backtest with Unravel API
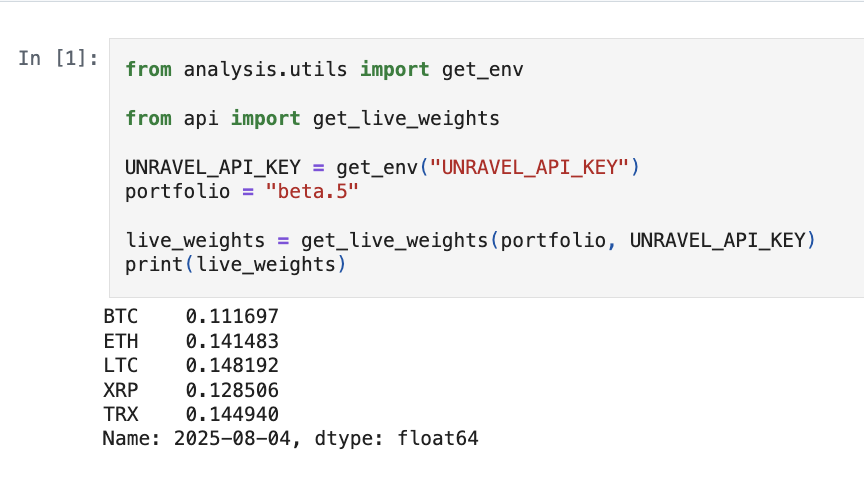
Get Live Weights
Get the live weights of the portfolio or the live factor data