We've got three updates this month, alongside the strong performance of the model multi-factor portfolios:
- A new factor, Enhanced Mean Reversion, now in the catalog
- Spectra adds it as a 7th factor, lifting risk-adjusted returns
- A change to the live endpoints, effective Friday, 29 May 2026
Live endpoint API changes
Two changes to the live endpoints take effect on Friday, 29 May 2026, and may affect your integration. The live endpoints now accept an as_of parameter with two valid values: close and latest. Send as_of=close for the end-of-day snapshot and as_of=latest for the intraday snapshot.
From Friday, 29 May 2026, the parameter defaults to close — this is the option we recommend building on for point-in-time consistency.
Please be advised that we do not yet recommend using as_of=latest, only in cases when you missed the UTC midnight rebalancing event by a substantial margin (10+ hours).
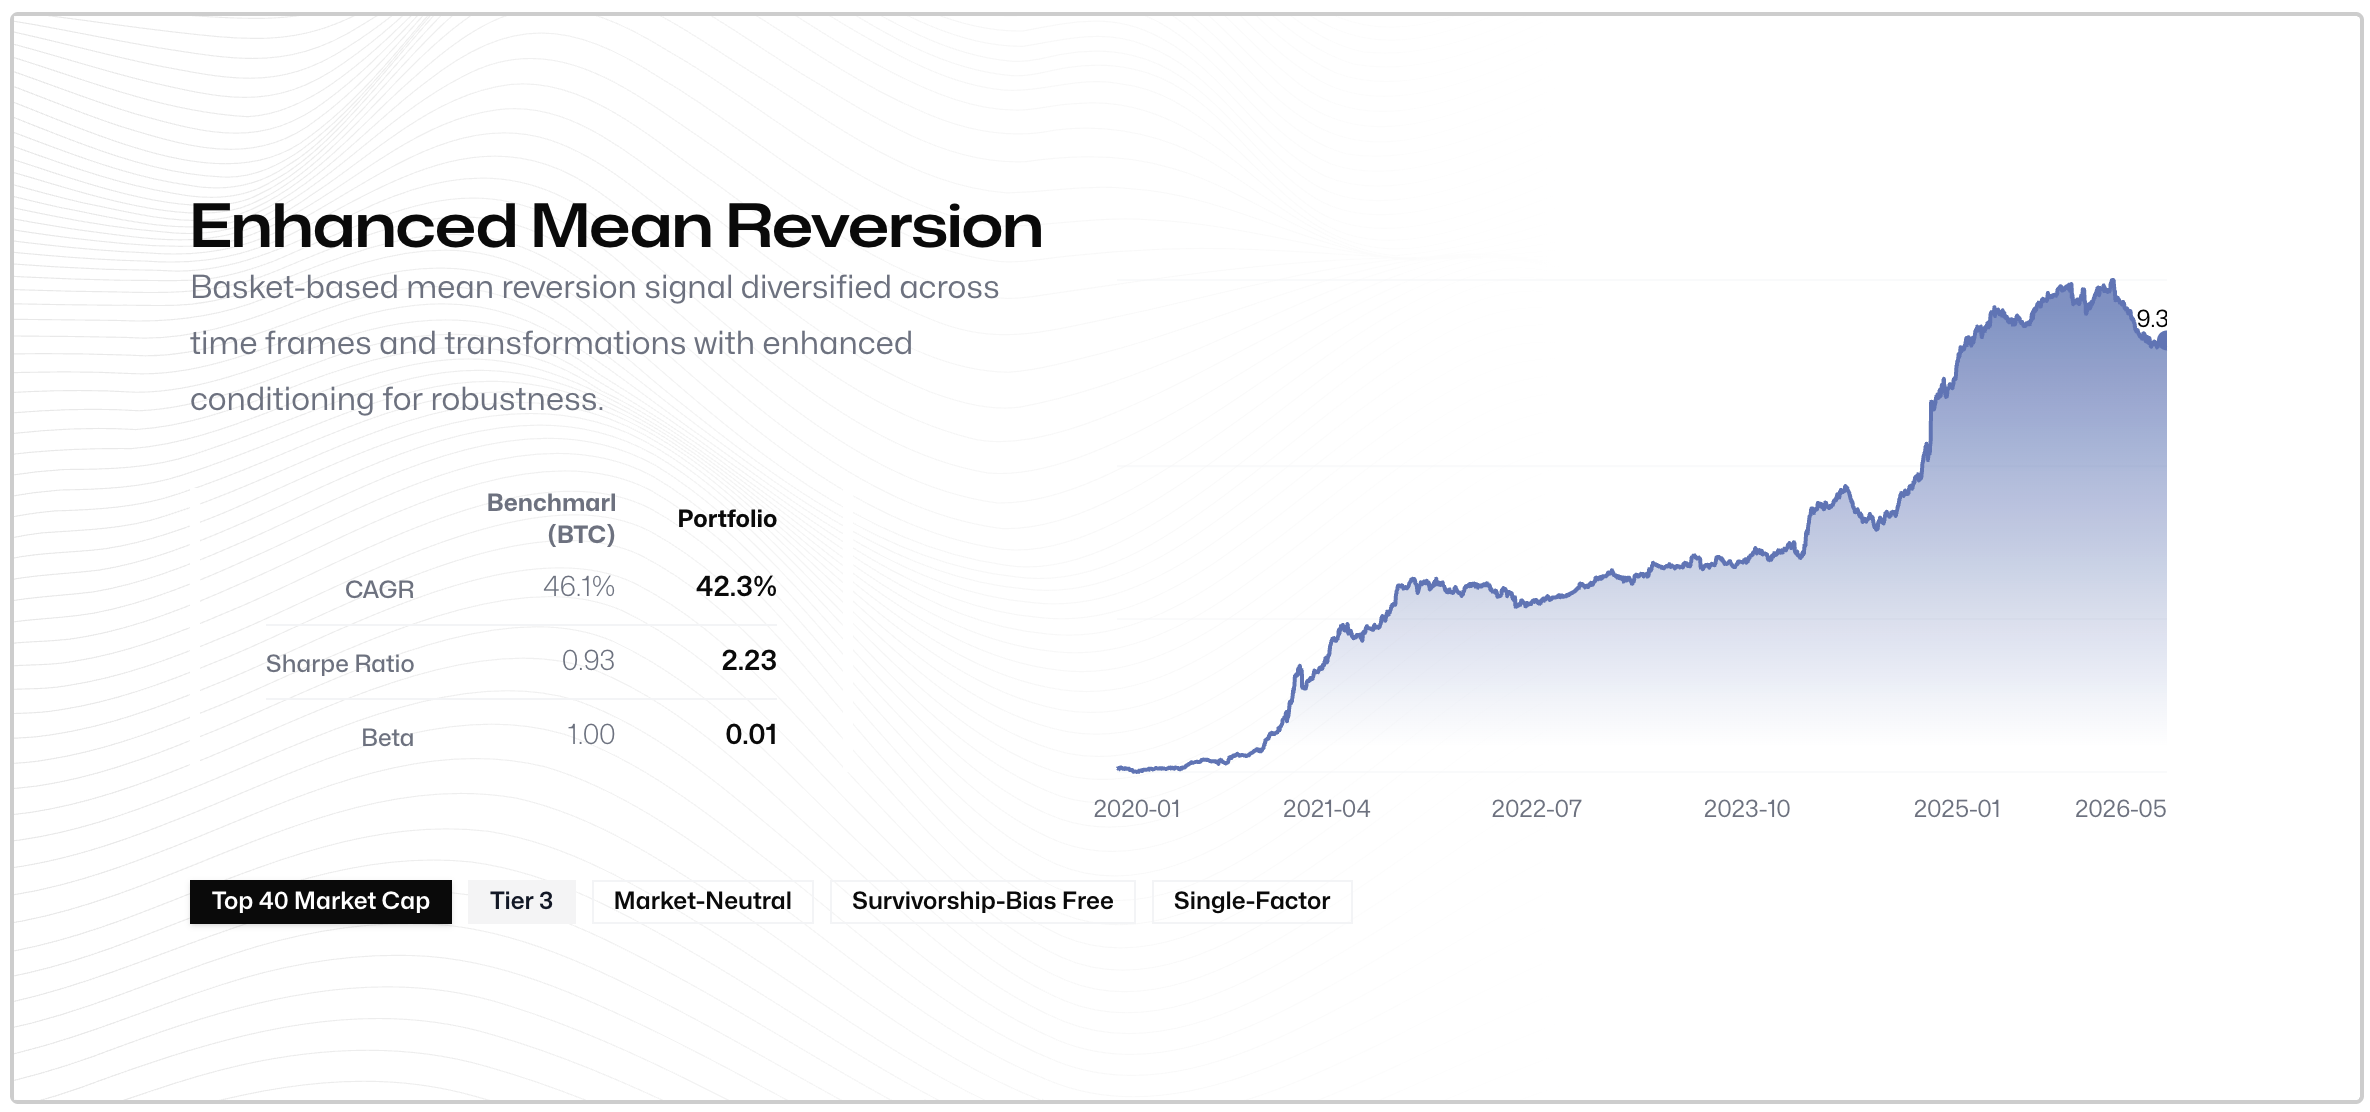
New factor: Enhanced Mean Reversion
"Mean reversion" can be measured in a variety of different ways. Here, we take a modern approach to pairs-trading: identifying baskets of mean-reverting assets (in a walk-forward manner) and using a wide range of transformations and lookback periods to identify an aggregate of each asset's mean-reversion score.
Pairs trading and these types of statistical arbitrage signals are usually done in a way that the baskets have a fixed number of assets, and an asset can be either part of it or not.
With our statistical arbitrage framework, we use a continuous methodology, where each asset has a probability of being part of a basket. When the signals are aggregated — with the aim of creating a cross-sectional score — we multiply the mean-reversion signal by the probability of the asset being part of every basket.
mean_reversion_enhanced.40 brings a number of new transformations and basket-definition methodologies and ensembles them.
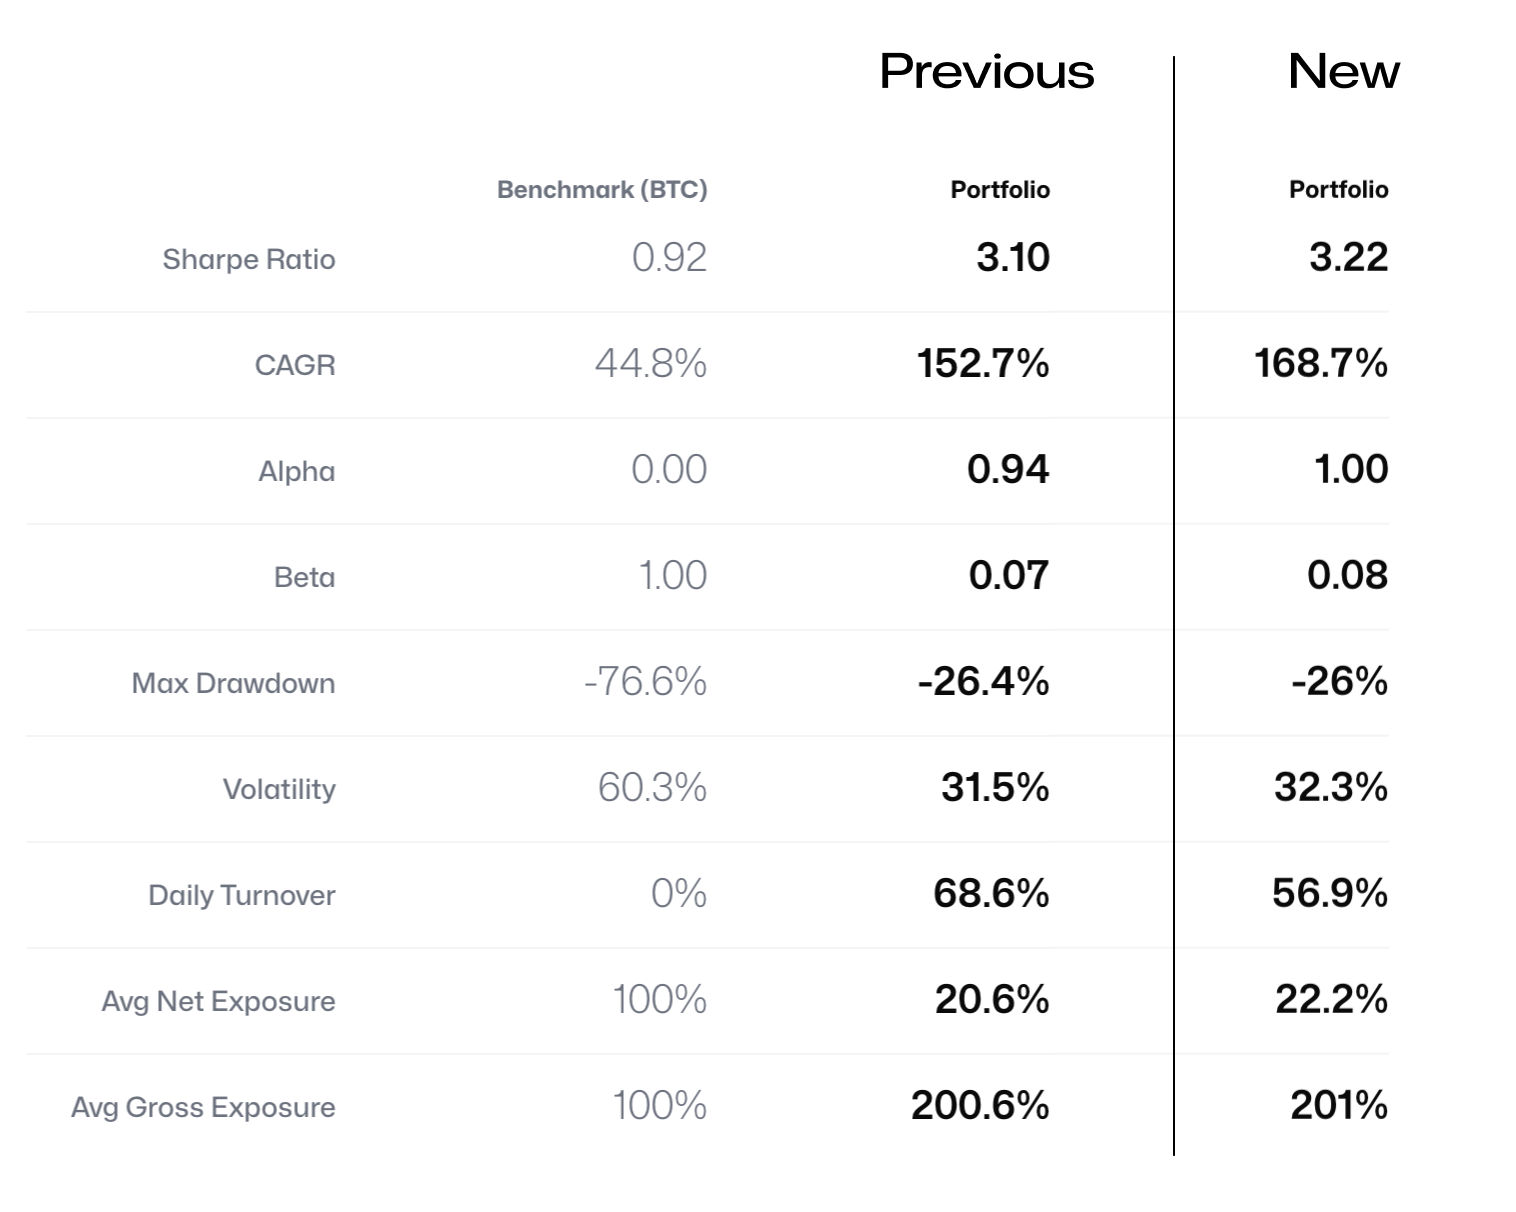
Spectra composition changes
Enhanced Mean Reversion joins Spectra as its 7th factor, as a strong addition. At ~0.3 correlation with the existing Mean Reversion factor, it's orthogonal enough, and adding it lifted the portfolio's risk-adjusted returns and CAGR by a meaningful amount.
The change is applied retrospectively, so historical weights and backtests reflect the updated seven-factor construction.
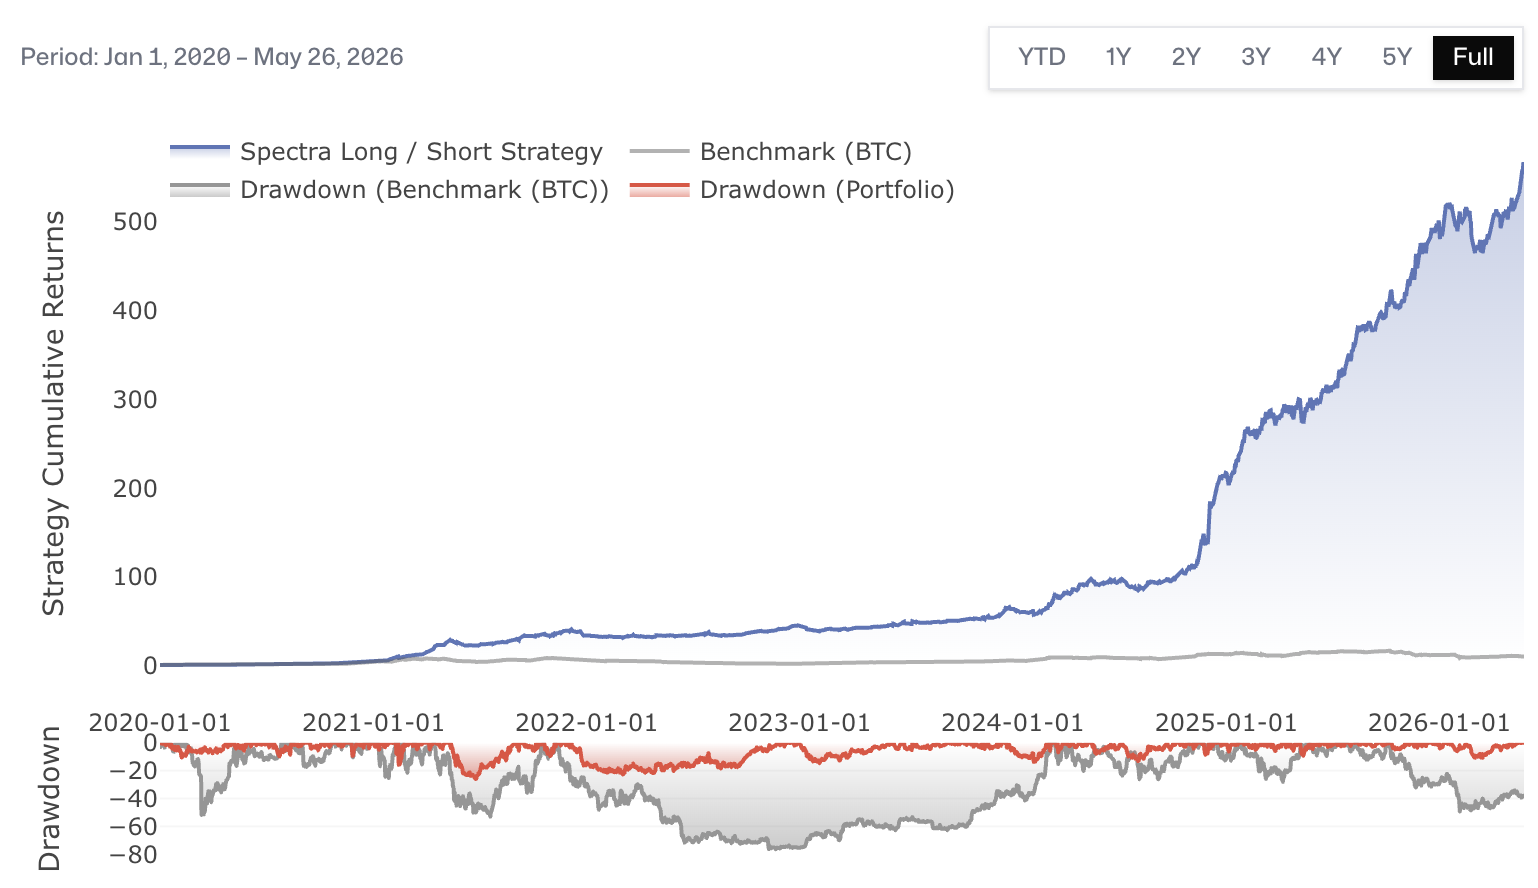
Cumulative Returns — New Portfolio
UI & resources: Data Room and factsheet downloads
We've made the data behind every factor and portfolio easier to get at, in two ways.
First, there's now a Data Room at github.com/unravel-finance/dataroom. It collects per-factor PDF factsheets, the raw factor data and portfolio returns as CSVs, and runnable notebooks for factor analysis, multi-factor portfolio construction, backtesting, and live weights, all in one place. Enhanced Mean Reversion is already there, with its factsheet, data, and analysis notebook.
Second, we've added download buttons to each detail page on the site, so you can pull a factsheet or the underlying data for any factor or portfolio directly from where you're already looking.
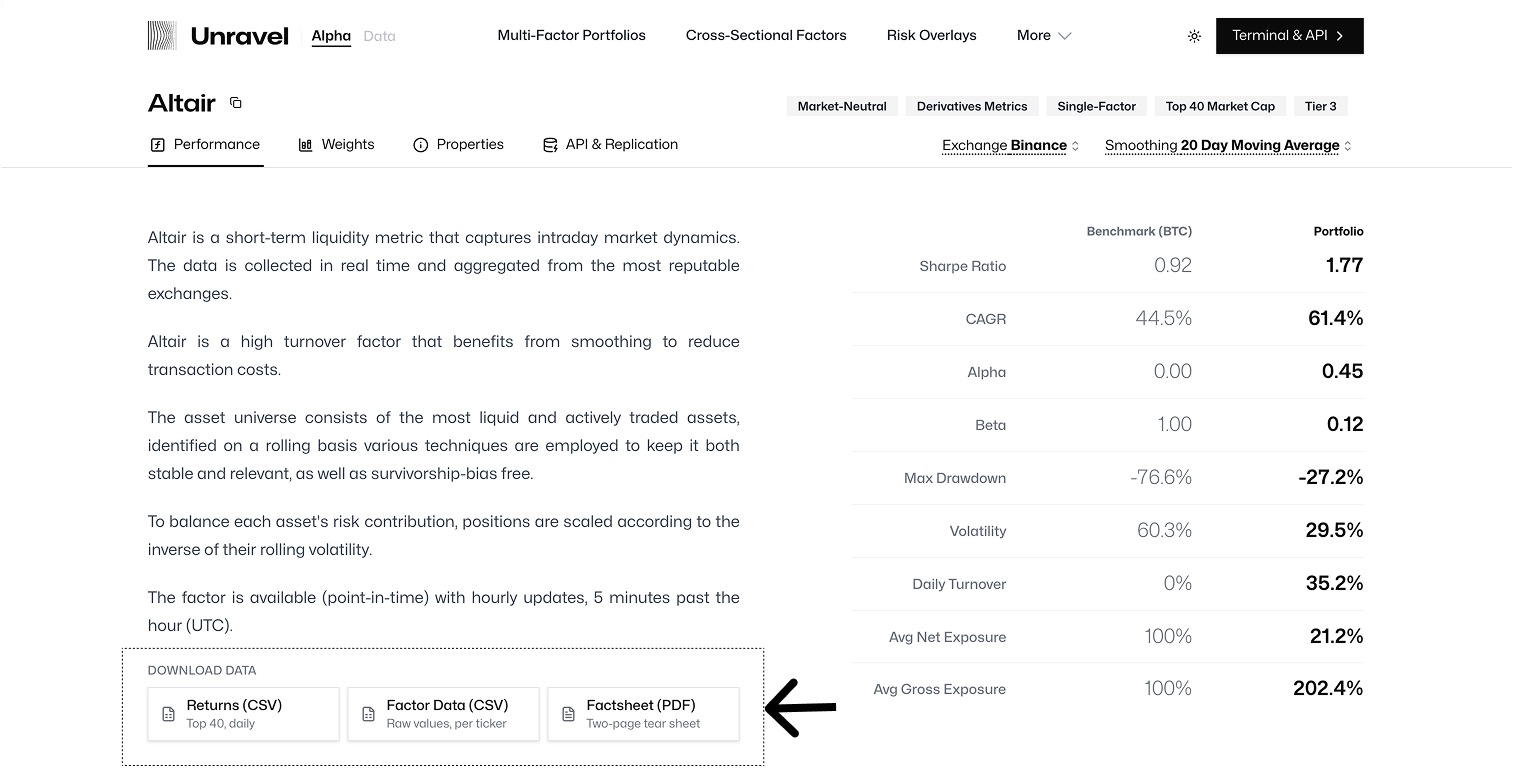
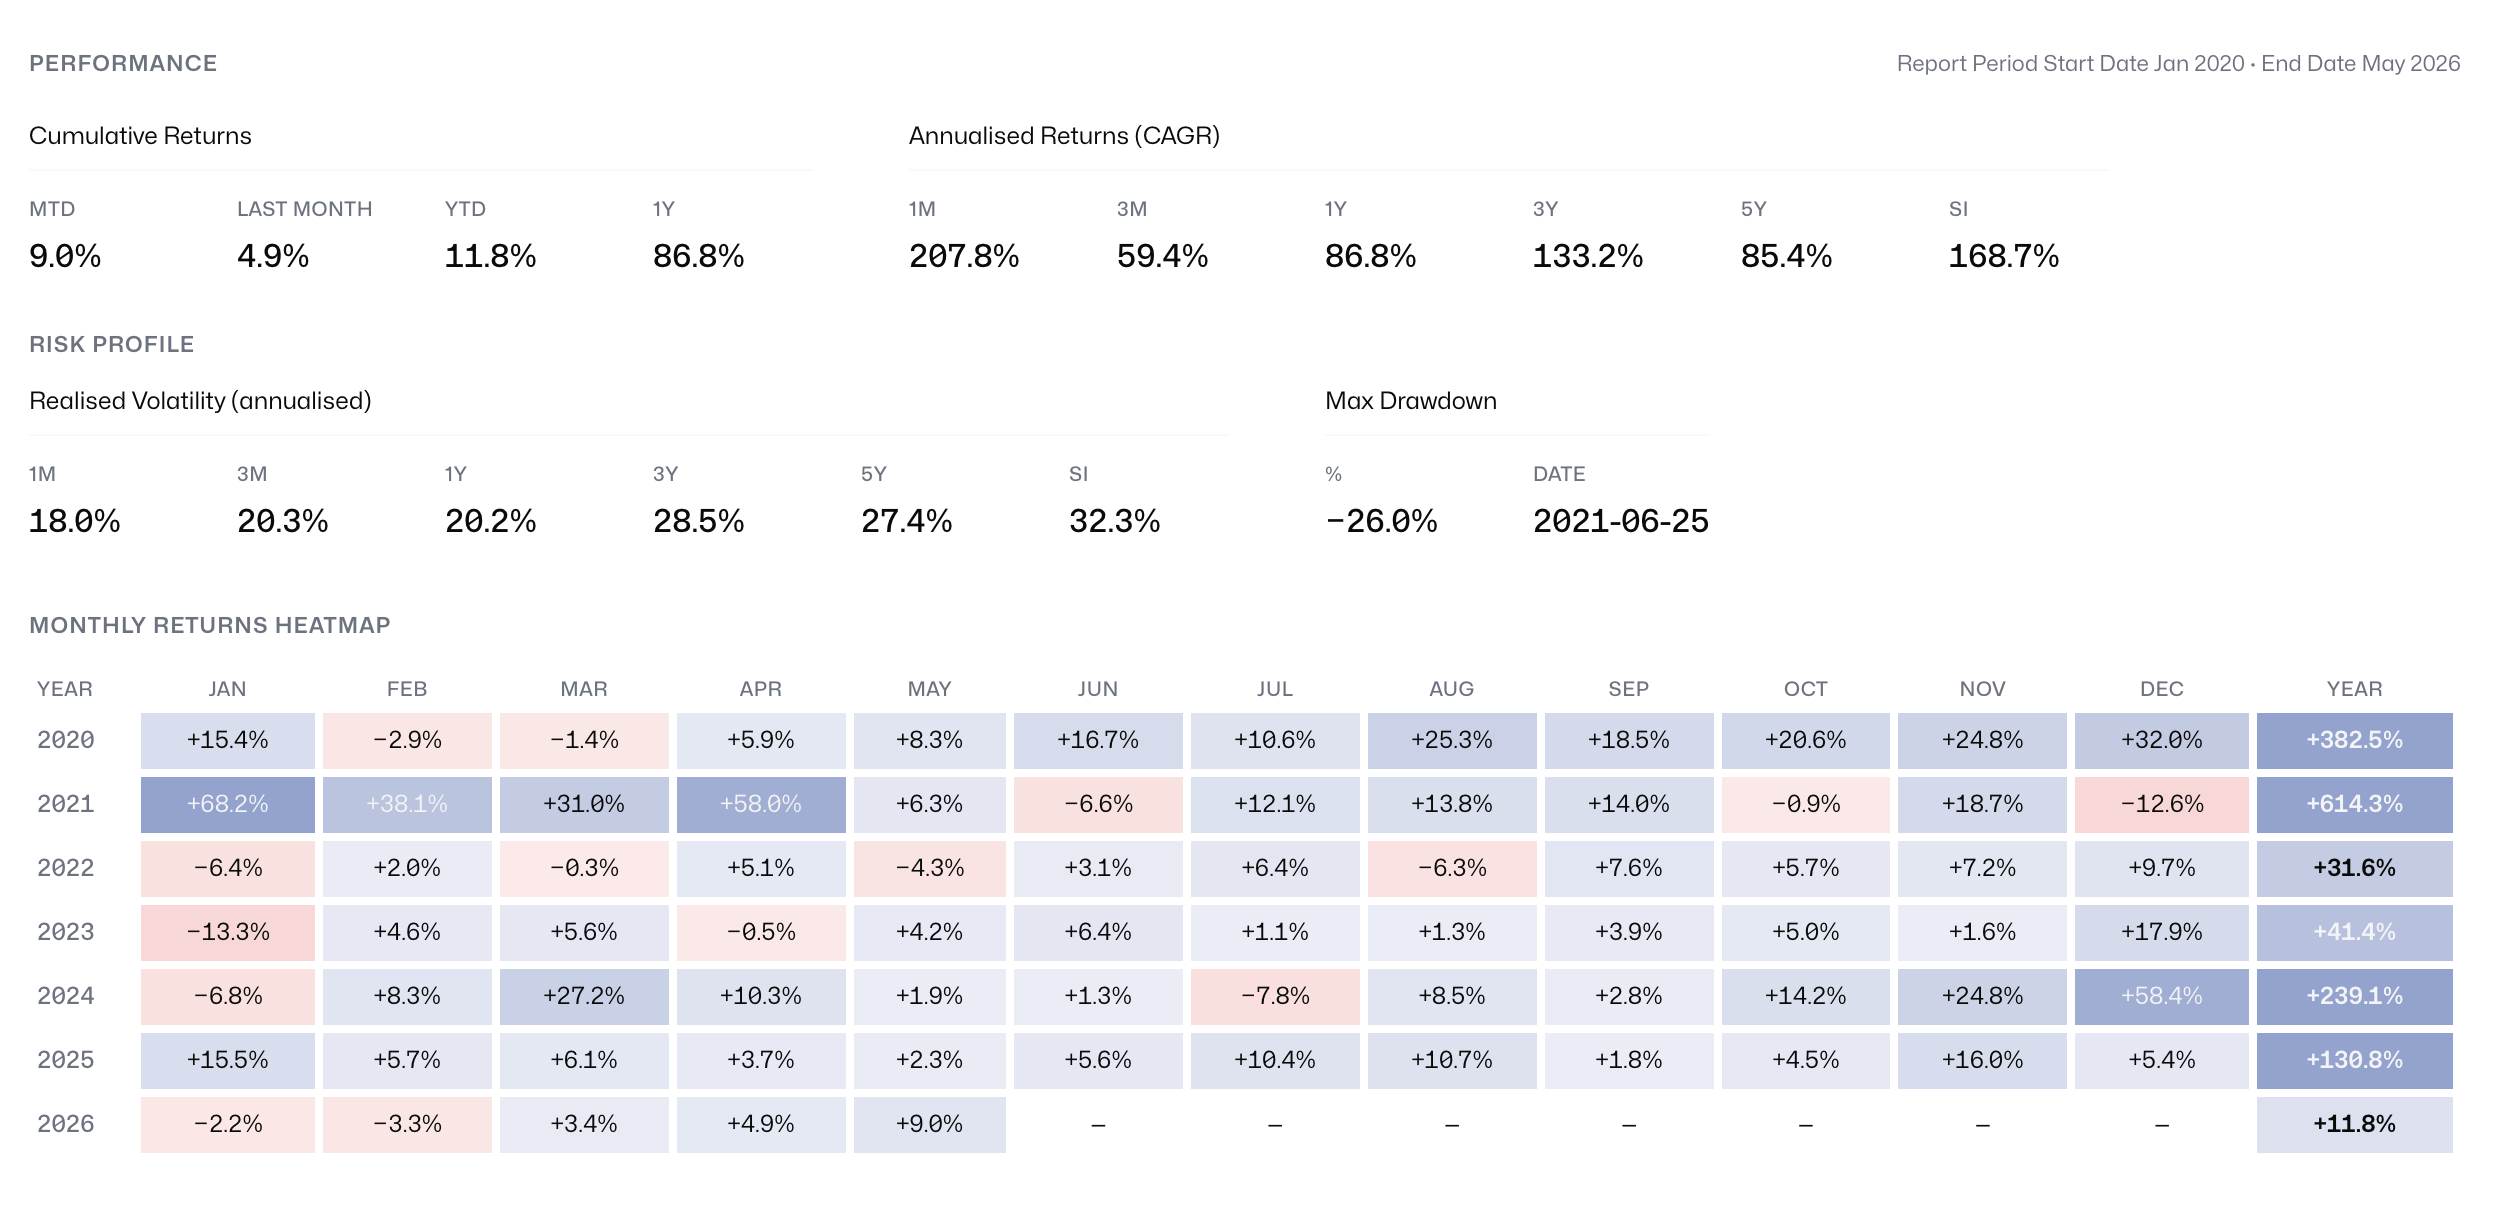
We've also improved each detail page on the site. You can now select the time interval on the performance chart, to reframe the cumulative-returns and drawdown chart. Each page also has a more detailed performance table, covering cumulative and annualised returns across different horizons, as well as realised volatility, max drawdown, and a monthly returns heatmap.
Removal of 5d & 10d smoothing options
We've removed the 5d and 10d smoothing options from the multi-factor portfolio weights endpoints — originally deprecated early 2026.
We're also continuing to focus our efforts on Aperiodic Live data, which will both complete the offering and enable us to add more Aperiodic-inspired factors to Unravel as well. Stay tuned for further updates!
For questions or assistance with integration, please contact us at support@unravel.finance.
The Unravel Team